🔥 Analyze options and see the hedging flows that can move futures
Options have become one of the key drivers of the futures market. To hedge their positions, market makers continuously buy and sell futures. This can produce "unexplained" reversals, levels, and sharp spikes right in the middle of the session.
We're launching two new indicator suites that give you a detailed view of the options market, from the daily structure down to 0DTE flows updated every minute.
Options X-Ray Suite: 0DTE analysis down to the minute
Daily Open Interest (OI) snapshots used to be enough. But 0DTE options have rewritten the rules: massive volumes expiring "today" can generate powerful impulses within the session. The factors behind market maker hedge adjustments (including Vanna and Charm) change throughout the day, and daily data simply can't keep up.
Options X-Ray Suite is a new generation of 10 indicators built on OptionsDepth's 1-minute analytics, derived from Cboe market data. The options book is recalculated every 60 seconds, so you can follow market maker hedging mechanics through the session (data updates once per minute).
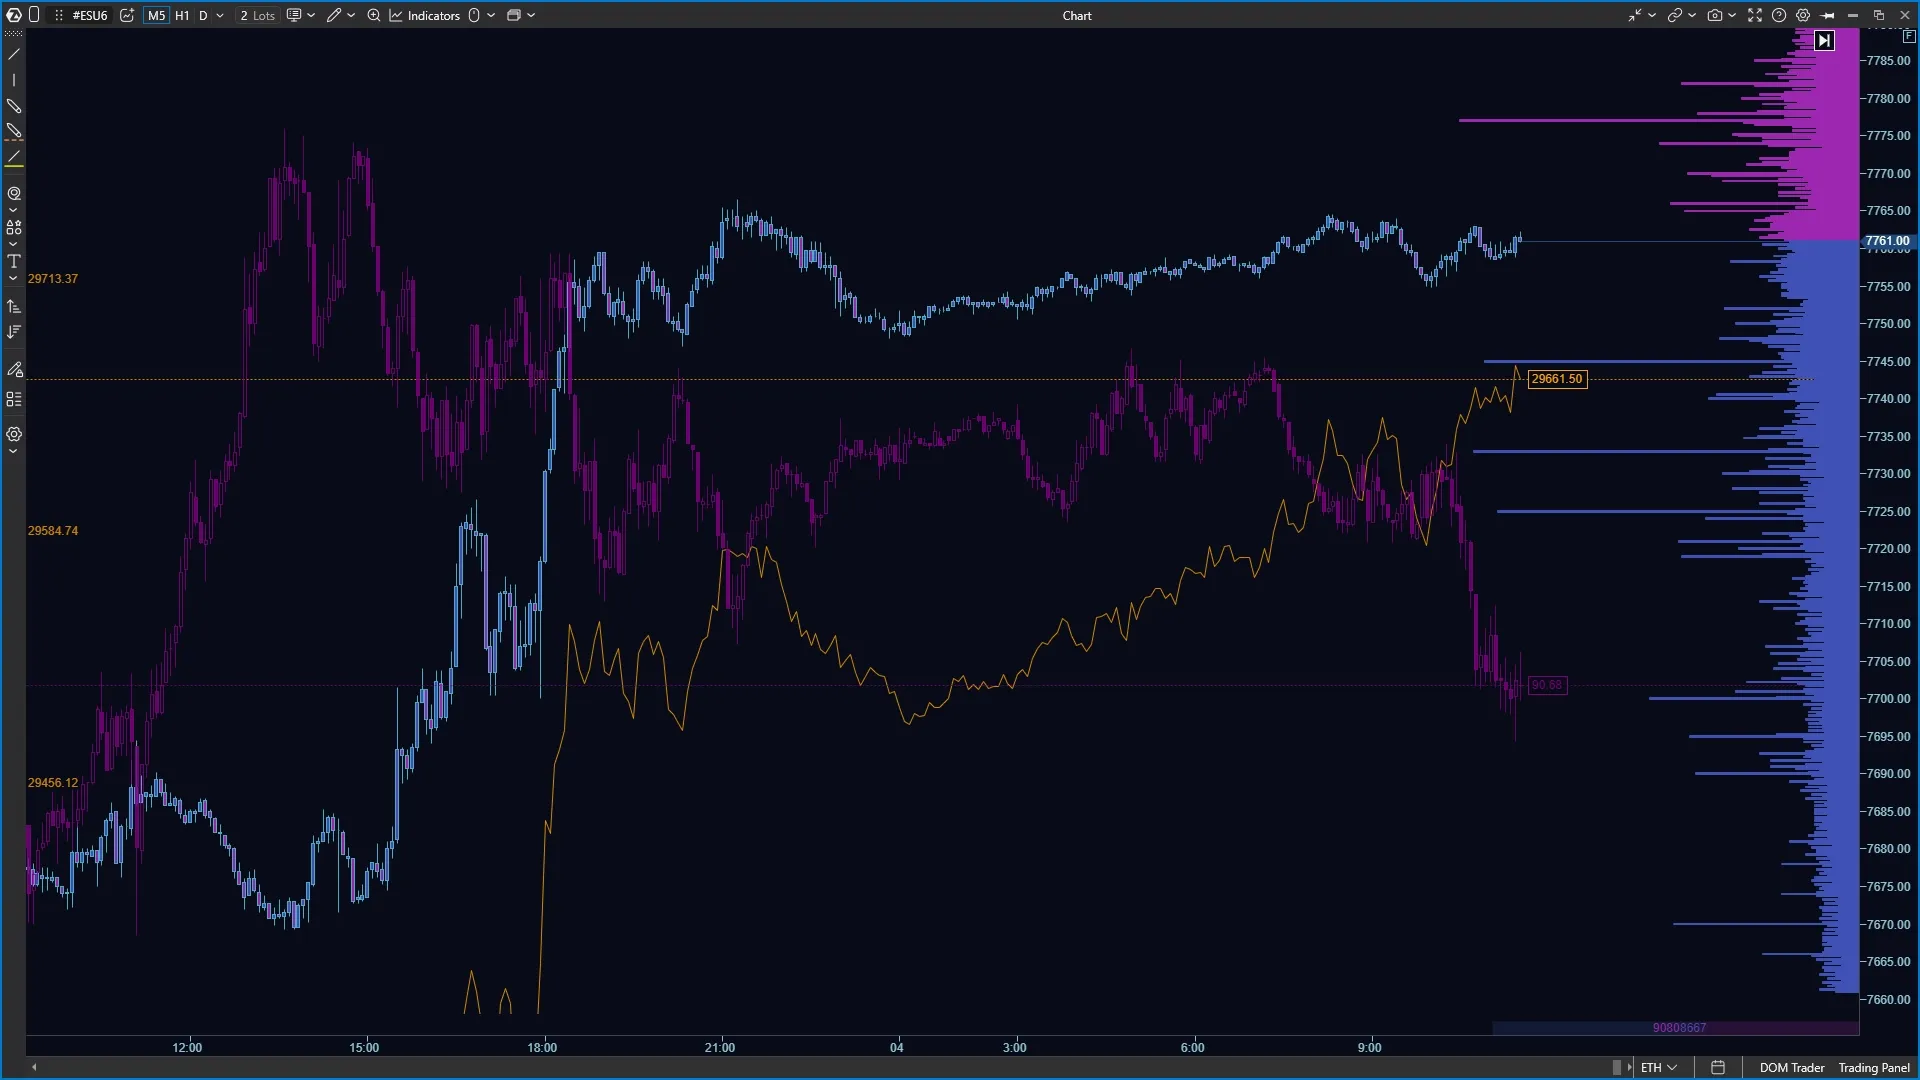
SPX options data, plotted directly on the ES futures chart:
Candles show where price is moving.
Footprint shows how volume builds the move.
Options X-Ray Suite shows why large hedging volume may be forced into the market, and the zones where market maker hedging can become a key driver of futures price.
What's inside Options X-Ray Suite:
Options X-Ray: Expected Move: the expected price range, derived from volatility.
Options X-Ray: Big Trades: large intraday trades, including position direction and participant types.
Options X-Ray: Flow: volume of bought and sold options by participant group.
Options X-Ray: Flow Delta: which way each participant group's demand is pushing.
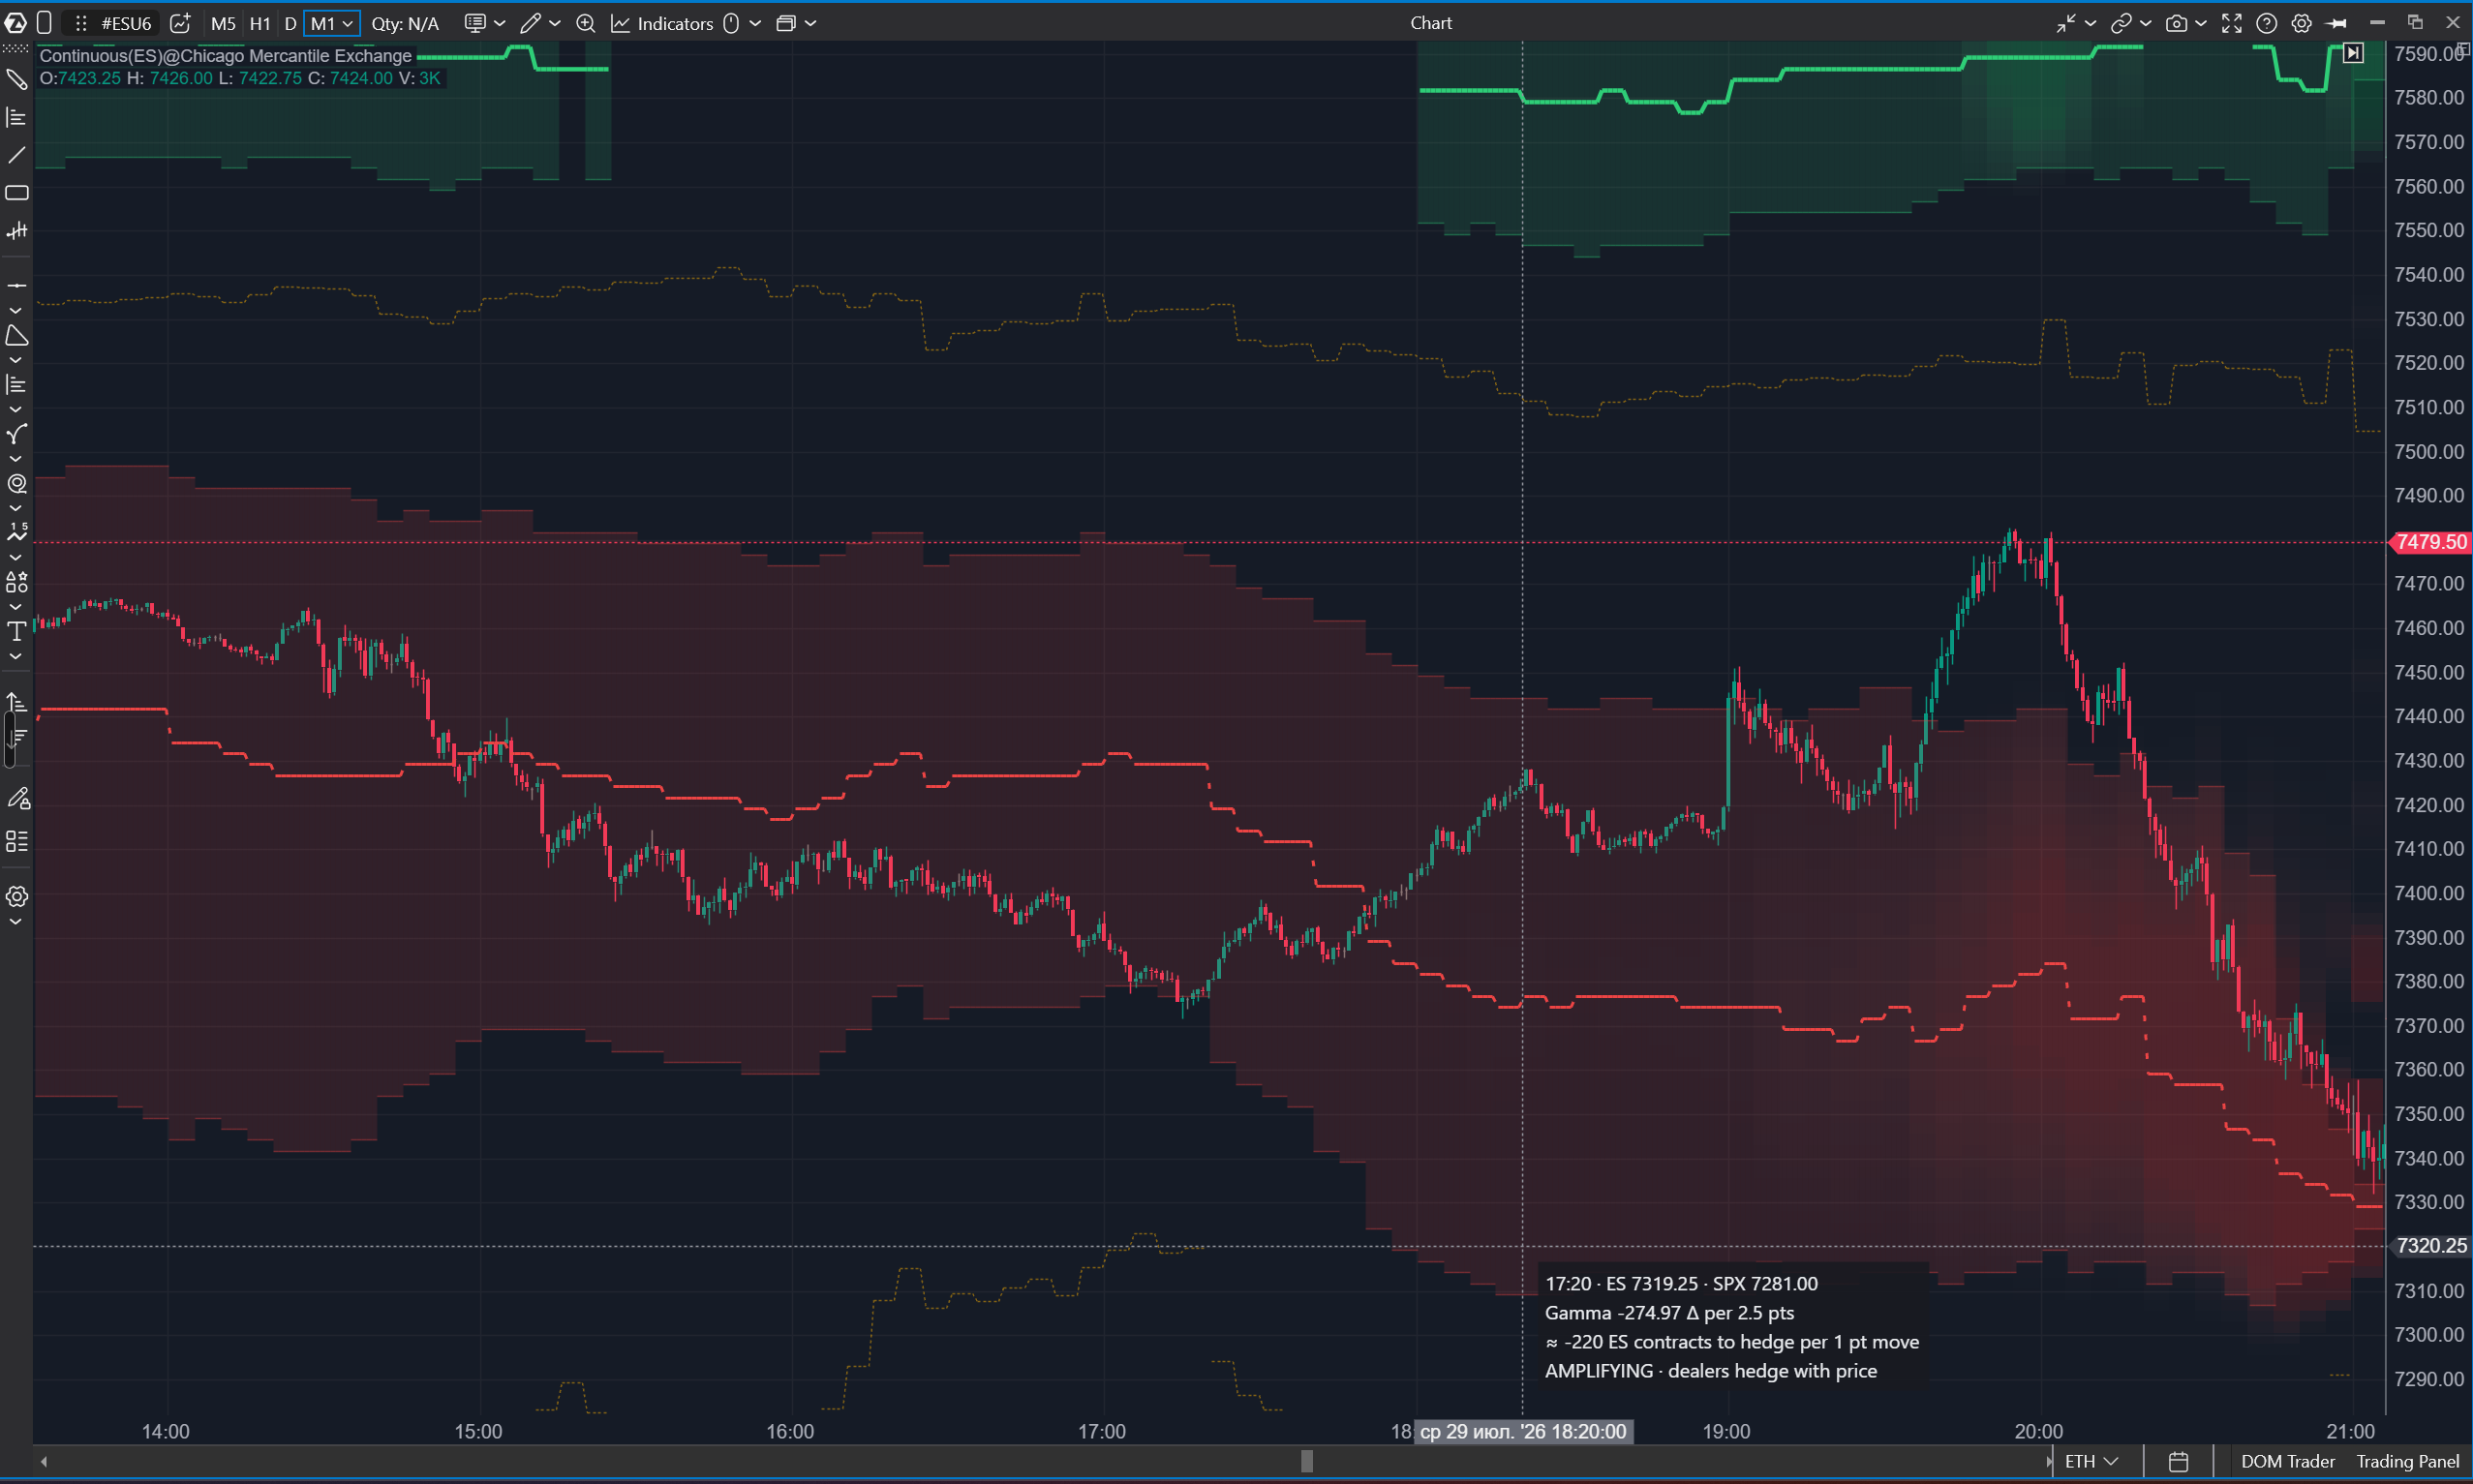
Options X-Ray: Surface Profile: a reaction model showing where market maker hedging may dampen a move, where it may amplify it, and where the estimated regime-shift zone lies.
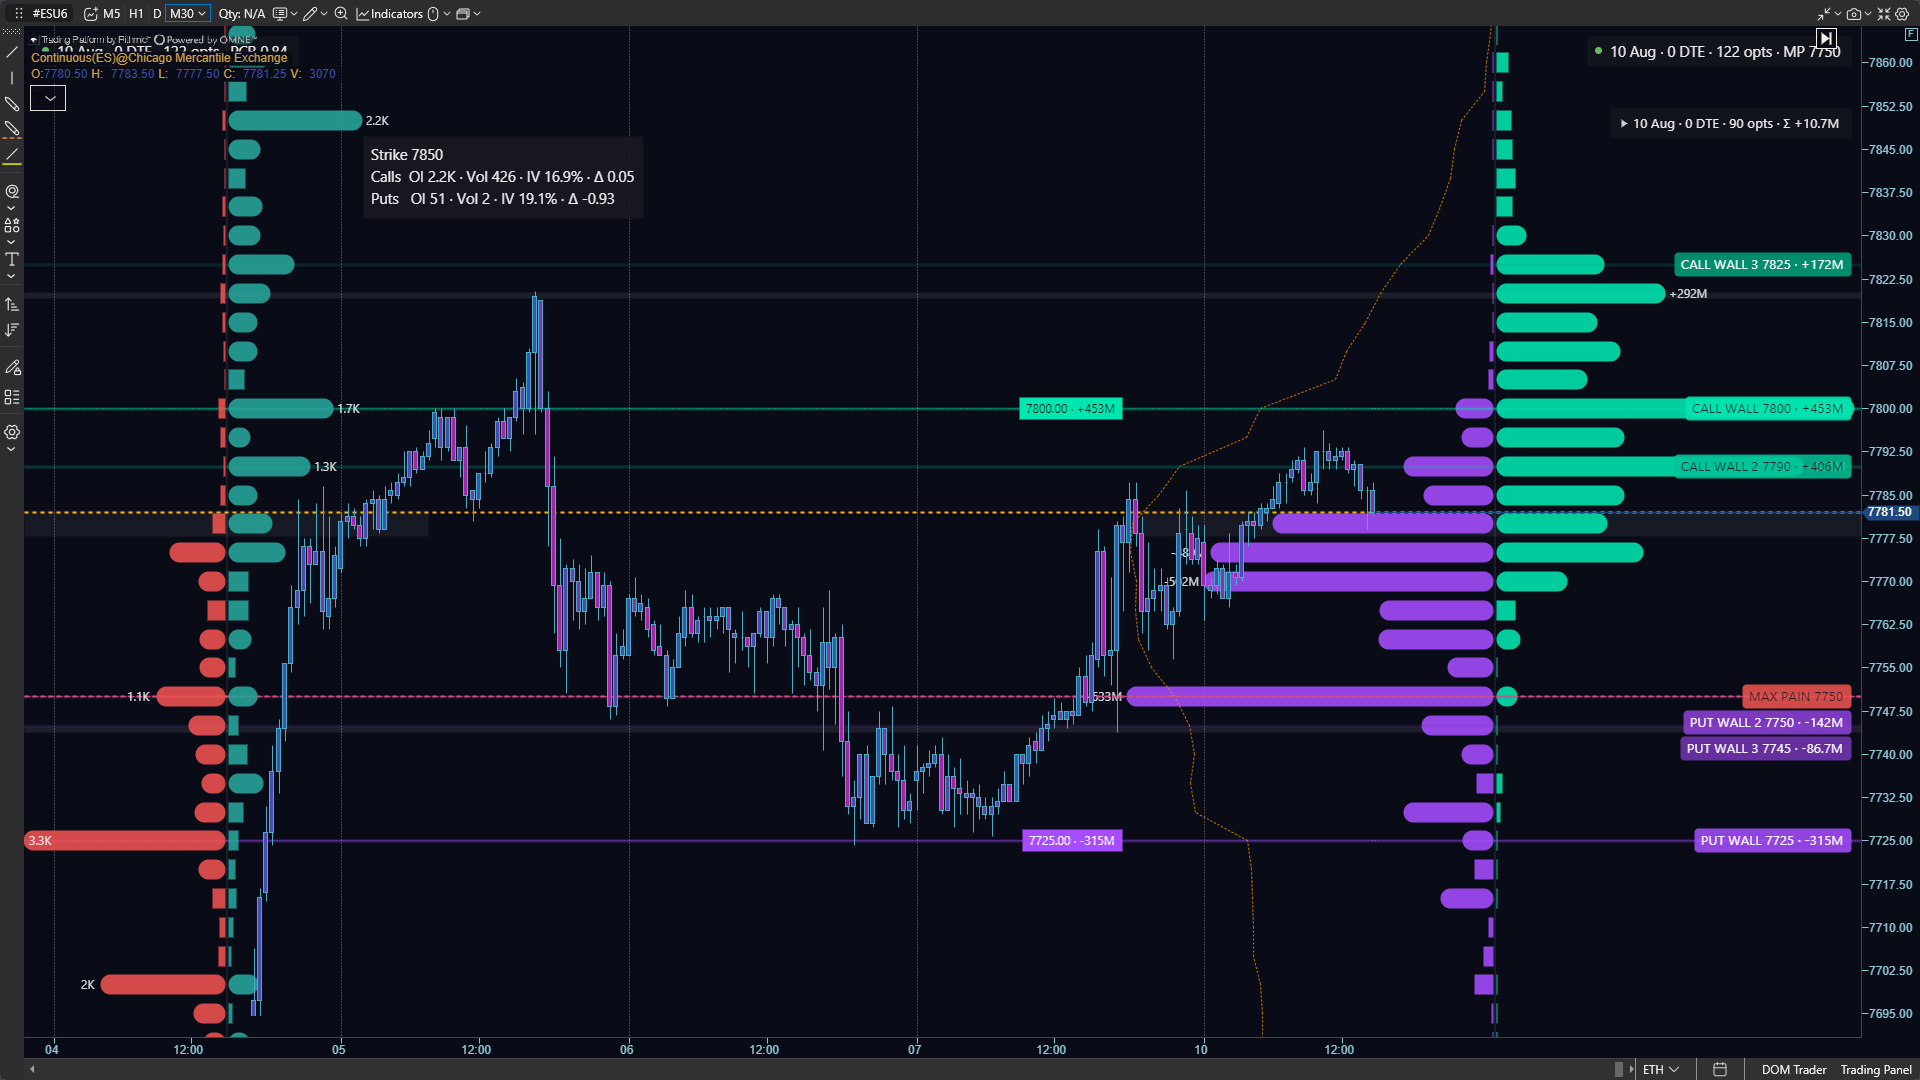
Options X-Ray: Strike Profile: exposure and walls at each strike, by participant group.
Options X-Ray: Strike Heatmap: how exposure across strikes shifts during the session.
Options X-Ray: GEX Heatmap: zones where market maker hedging may slow down or accelerate price.
Options X-Ray: Charm Heatmap: market maker hedging zones as expiration approaches.
Options X-Ray: Market State: a summary panel that combines the readings of all indicators and clearly marks what is observed data and what is model output.
💡 Available on the Ultra plan. Built on OptionsDepth analytics derived from Cboe market data — no third-party options data feeds to connect. The ES chart needs a connection to any quote source; delayed data works too.
Options X-Ray works on ES, MES, SPY and US 500 charts; the chart itself needs a connection to any quote source (delayed data works too).
Options Chain Suite: key level analysis
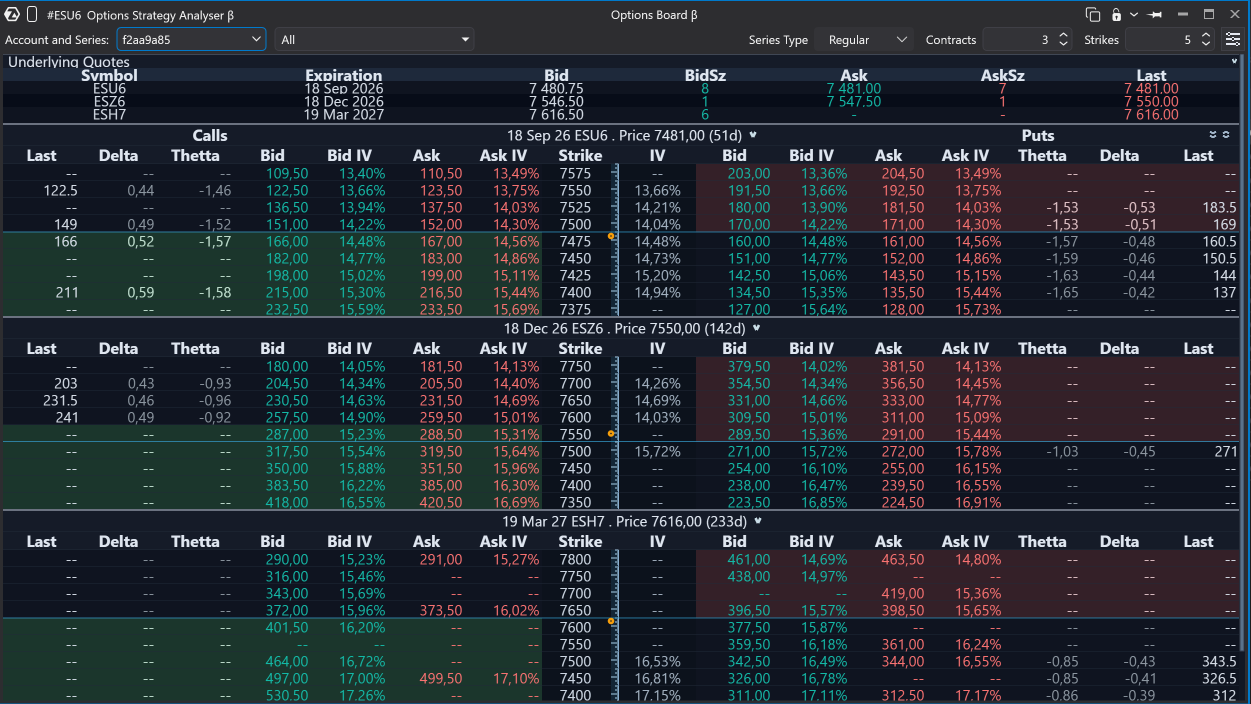
If you build medium-term context and map out strategic reference zones for the whole session, we've also added Options Chain Suite. It's 4 indicators that work with the live options chain from your connected broker for futures and stocks (ES, NQ, CL, GC, and more).
What's inside Options Chain Suite:
Options Chain: Expected Move: the expected price range based on options IV.
Options Chain: OI Profile: OI and volume profile by strike.
Options Chain: Key Levels: key options levels plotted on the chart.
Options Chain: GEX Profile: gamma exposure (GEX) and dealer hedging zones.
☝🏻 Available on Pro and Ultra plans. Requires a Rithmic or Interactive Brokers connection (CQG, Bybit, and Binance support is in development).
🚀 Update ATAS to the latest version and switch on your X-ray of the options market today!
Already on Ultra? After updating, open an ES chart and find "Options X-Ray" in the indicator list.