DELTA DIAGONAL
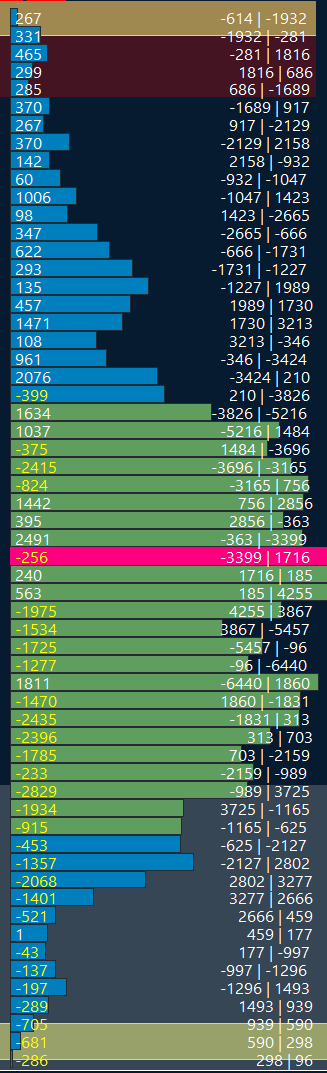
this is what it look like in sierra chart :
Diagonal Ask Volume - Bid Volume: This displays the diagonal difference between the Ask Volume and Bid Volume. The calculation always uses the Ask Volume first, which results in the same values diagonally opposing instead of being negatives of each other as seen when using Diagonal Ask Vol Bid Vol Difference. The Bid Diagonal Ask Volume - Bid Volume is defined as: Bid Diagonal Ask Volume - Bid Volume = Ask Volume at Next Higher Price - Bid Volume at Price. The Ask Diagonal Ask Volume - Bid Volume is defined as: Ask Diagonal Ask Volume - Bid Volume = Ask Volume at Price - Bid Volume at Next Lower Price. The information is displayed as Bid Diagonal Ask Volume - Bid Volume | Ask Diagonal Ask Volume - Bid Volume - for example -51 | 530. Refer to Diagonal Comparison of Bid Volume and Ask Volume for more information on diagonal comparisons.
have this in atas will be asome otherwise i will be force to leave ATAS for sierra
Log in to comment and vote
Comments2
Michael
Sep 22
•Merged request
•1 vote
Diagonal Delta
Simply provide an option to display delta within a footprint either linear or diagonally.
Why? Linear tells you what happened and diagonal tell you whether the behavior is continuing or not.
Thanks for considering!
nathanlee
May 14, 2025
Nice i need too