Volume Profile - Draw High Volume Node / Low Volume Node lines in Areas
It would be nice to have the option to add lines with a "plus" sign and a condition in the volume profile indicator.
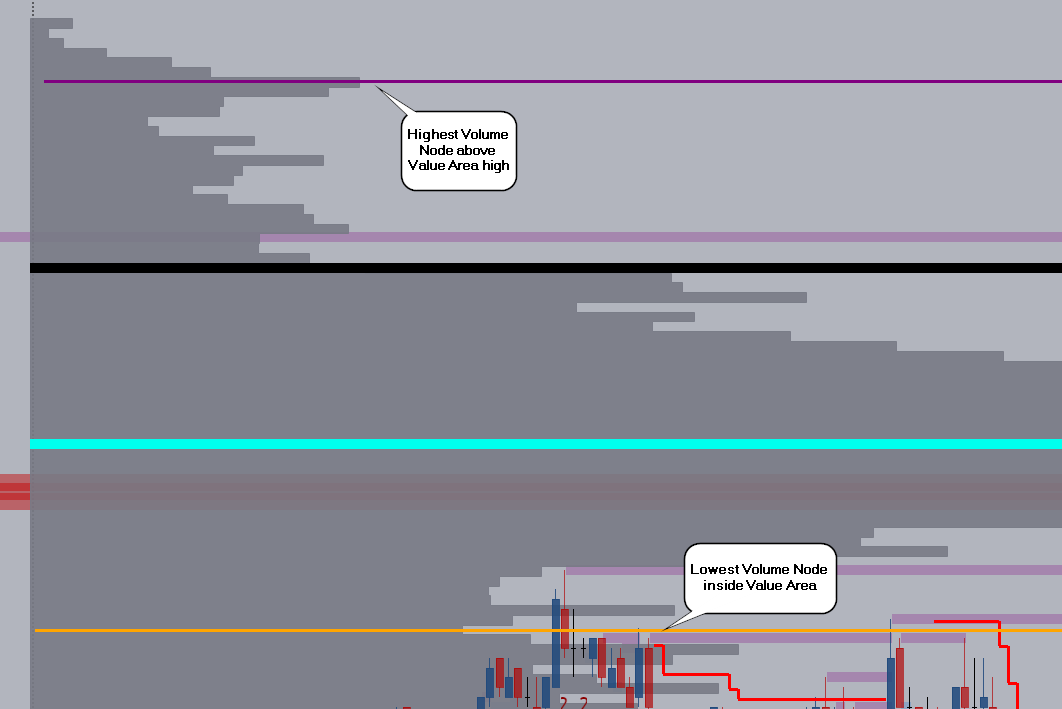
For example I want to draw automatically the highest high volume node above the Value Area high, so it could look like this:
click plus icon -> add line 1 -> condition "high volume node" -> area = Value Area -> "above
click plus icon -> add line 2 -> condition "low volume node" -> area = Value Area -> "inside"
Log in to comment and vote
Comments1
JD
Feb 26
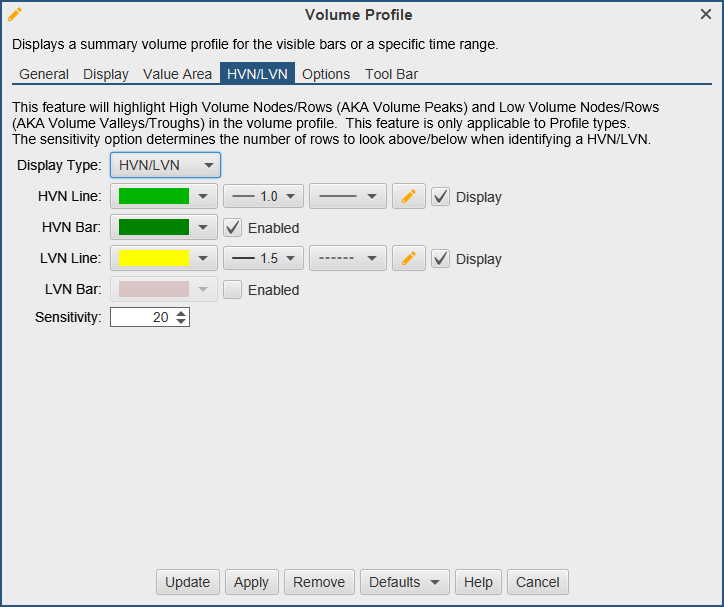
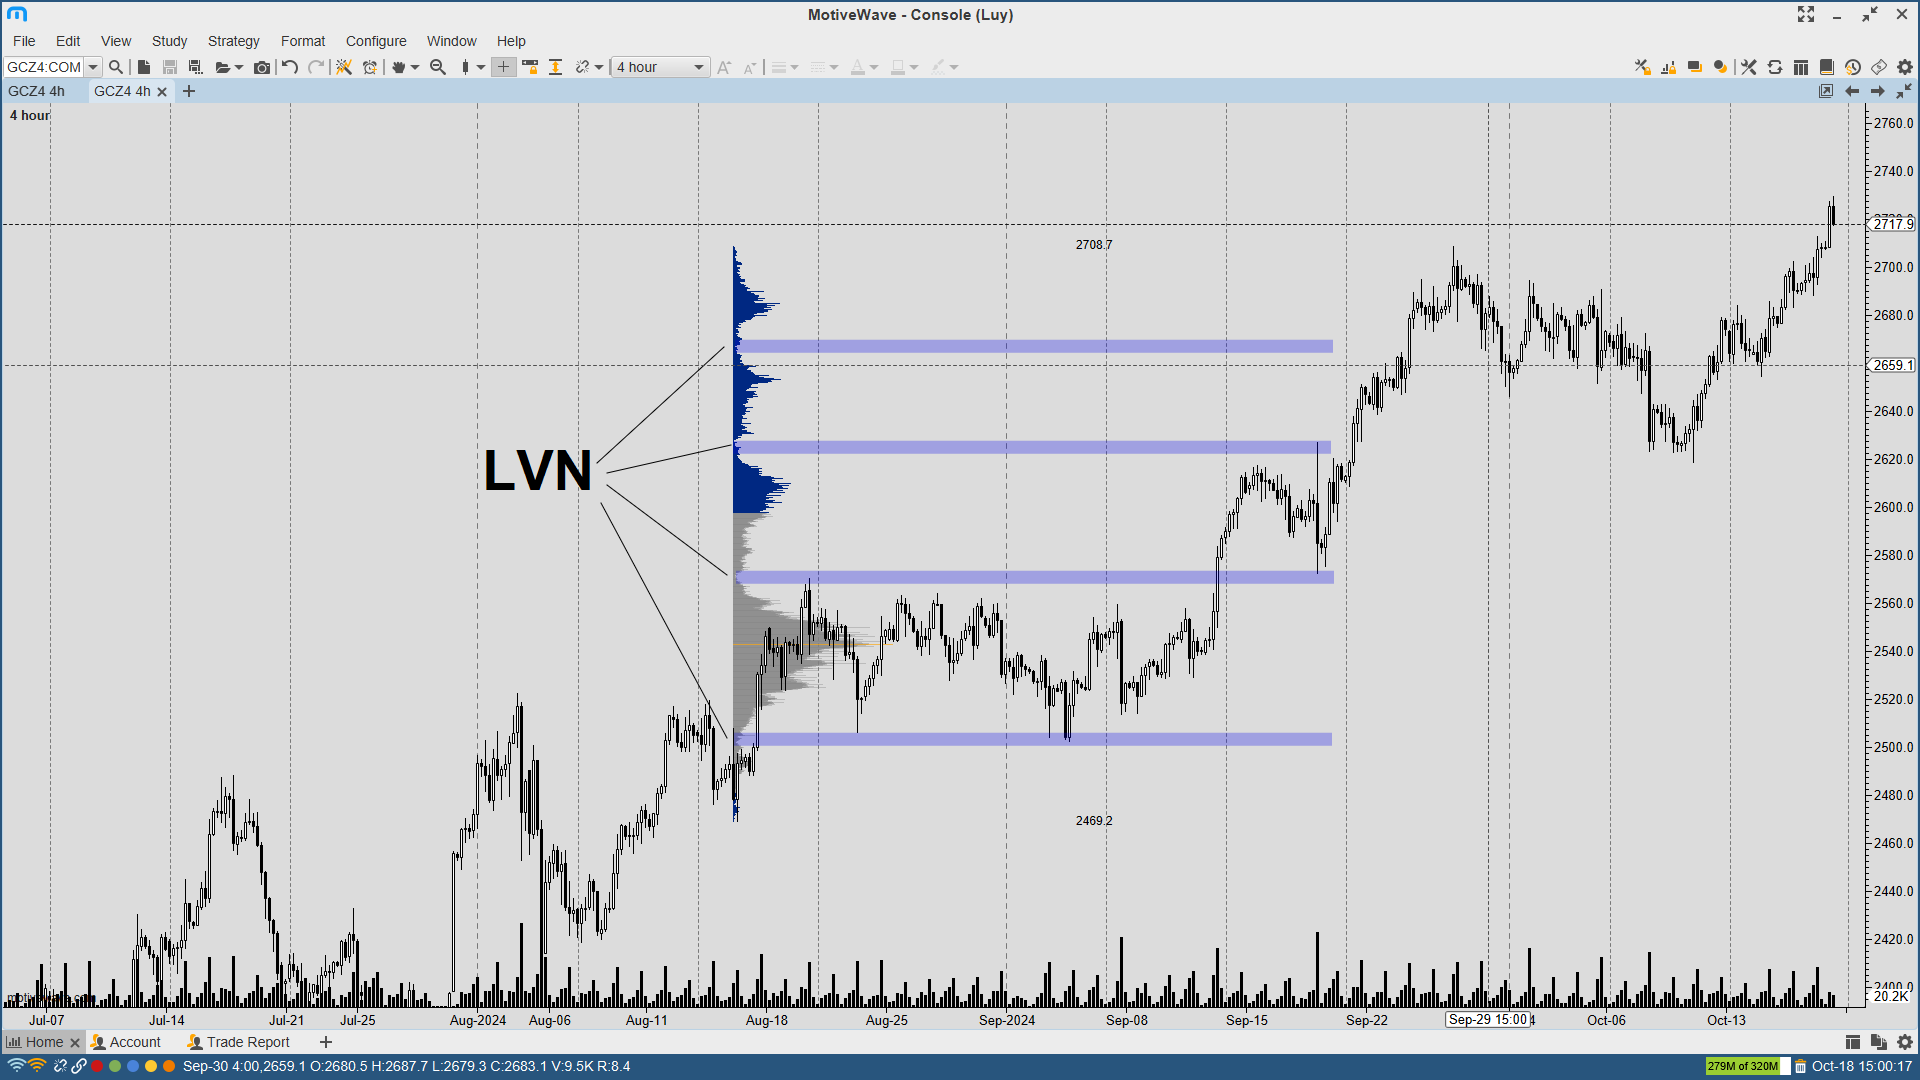
This would be the feature that would make me hit the buy button for your platform. I found that manually going through the LVN’s to highlight them from a composite volume profile that spans 3-20 days is very challenging to get right, as the sensitivity for variation is only your eyeballs. ATAS is the favourite, but Motivewave has this feature standard. The sooner you can code this in, the sooner I’m your customer…along with a number of others. Thanks for your consideration. Cheers