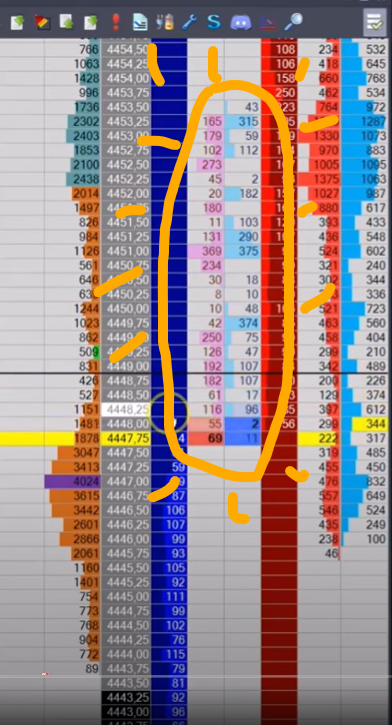
Display the Volume histogram for Current Buys and Sells columns(like Jigsaw)
One of the shortcomings of the ATAS DOM is that its inside print does not display a histogram.
When trading DOM, speed is crucial, and this option will allow you to see instantly at which levels there was the most or least volume during the last movement.
Adding this option would add real value to ATAS.
Log in to comment and vote
Comments5
ATAS user
Sep 13, 2024
Done! It is available since v7.0.2.223 beta
Anonymous User
Sep 13, 2024
Great! Thank you very much!
Nico
Jul 18, 2024
I would also be very interested in this feature. Thank you ATAS Team.
Akrem
Jun 26, 2024
look at the templates , there's one there
Olivier Decesse
Jun 27, 2024
Hi Akrem,
Can you tell me which template?
Because if "Sell curent trade" and "Buy current trade" don't have a histogram display, their big advantage is to allow you to reset the columns each time the price comes up (in order to see precisely the last movement).
Conversely, the "Trade" columns have a histogram, but are reset at least every minute. This is far too long when the market is volatile and you want to see exactly what happened on the last move.
You'd either have to be able to reset "Trades" every time the price moves (and set a margin, in my case of 5 seconds), or add a histogram to the "Sell curent trade" and "Buy current trade" columns.
ATAS has very good analysis functionalities, and there's not much missing for its DOM to enable scalpers to execute with precision.