See history of trades taken on the chart (plot the arrows of buys and sells for history)
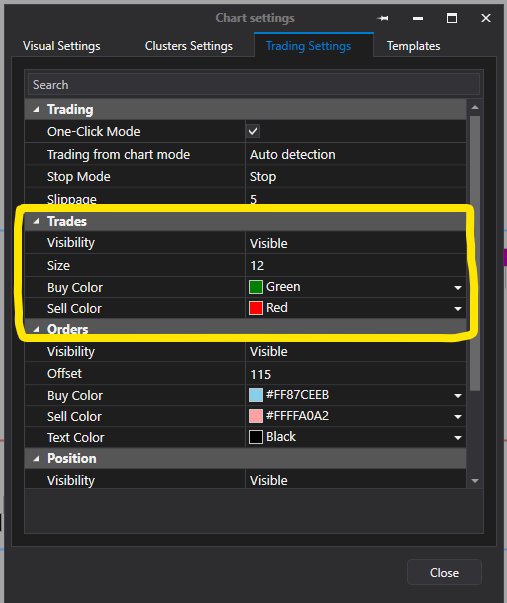
The ability to plot the trades and make visible the buy and sell points on the chart for previous days or weeks. This helps with analysis of trades taken and saves time. Currently we need to go to history and manually input the trades on the charts. So on this page (see image) we need an option for history and how many days we want to plot trades. Thanks!
Log in to comment and vote
Comments1
Vanodga
Oct 9, 2024
Hello!
There are indicator Trades on Chart, which has the functionality you described in this post; it was recently added to the platform. It is available in the Latest version. :)