HERRAMIENTAS
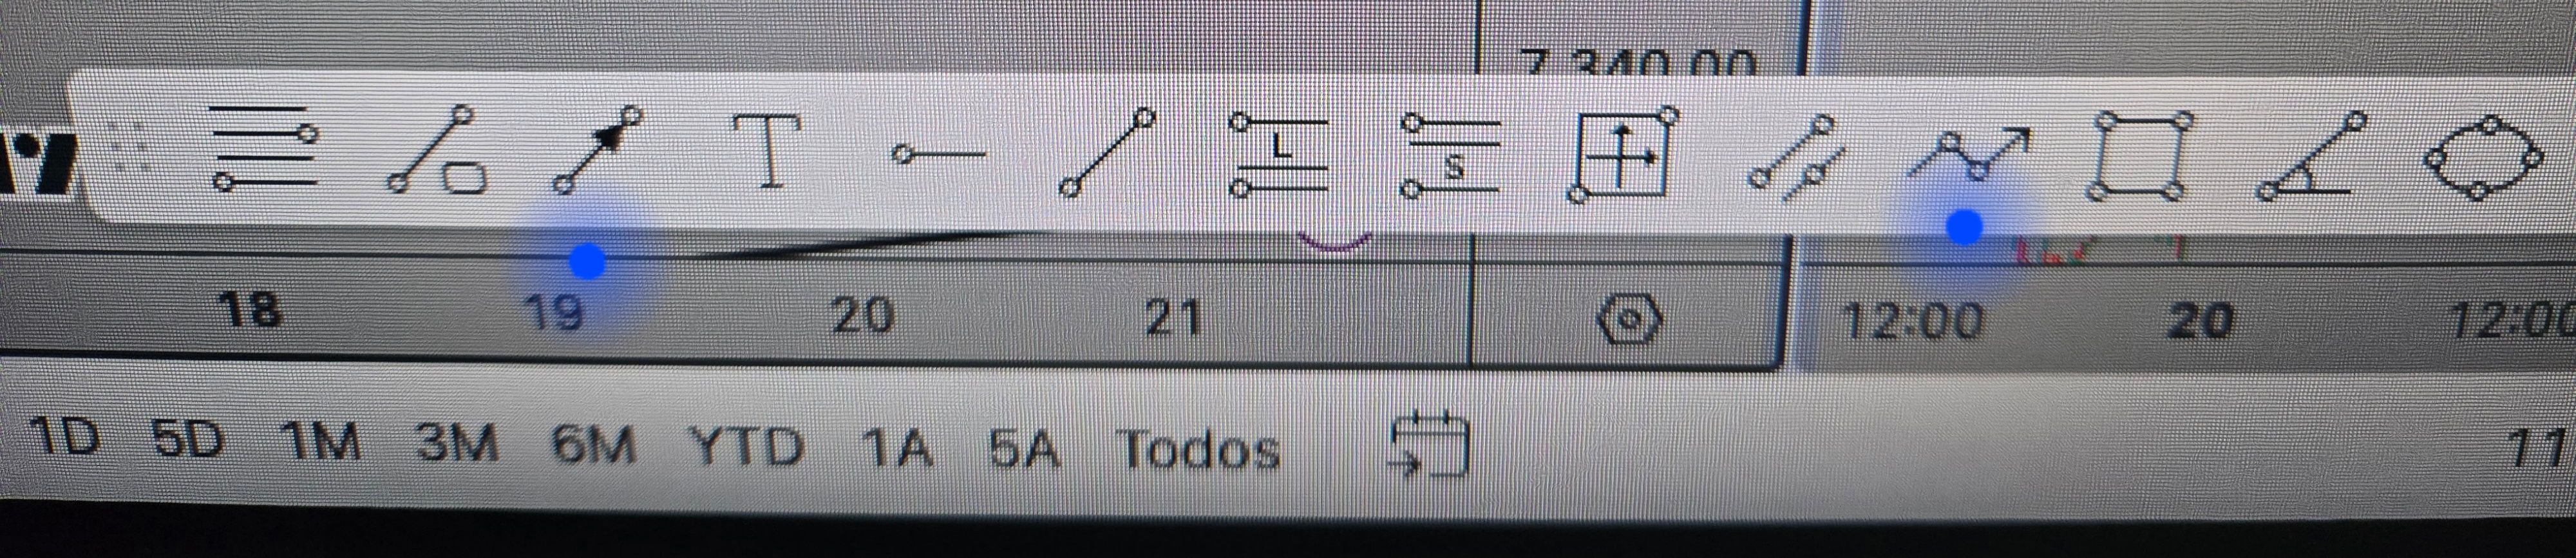
Good afternoon. I'd like to suggest introducing two new drawing tools that can be displayed on each timeframe selected by the trader on this platform. One would be equivalent to displaying a trading view route, which is basically a zigzag pattern, but as a drawing tool. It's simple but effective, showing nothing more than the highs and lows that the trader wants to represent on the chart.
On the other hand, I'd like to have a drawing tool like an "arrow" in the trading view, which can be displayed on the timeframe the trader chooses and shows the number of candles from the beginning to the end
.
Log in to comment and vote
No comments yet
Be the first to share your thoughts.