Drawing tool : Linear regression channel
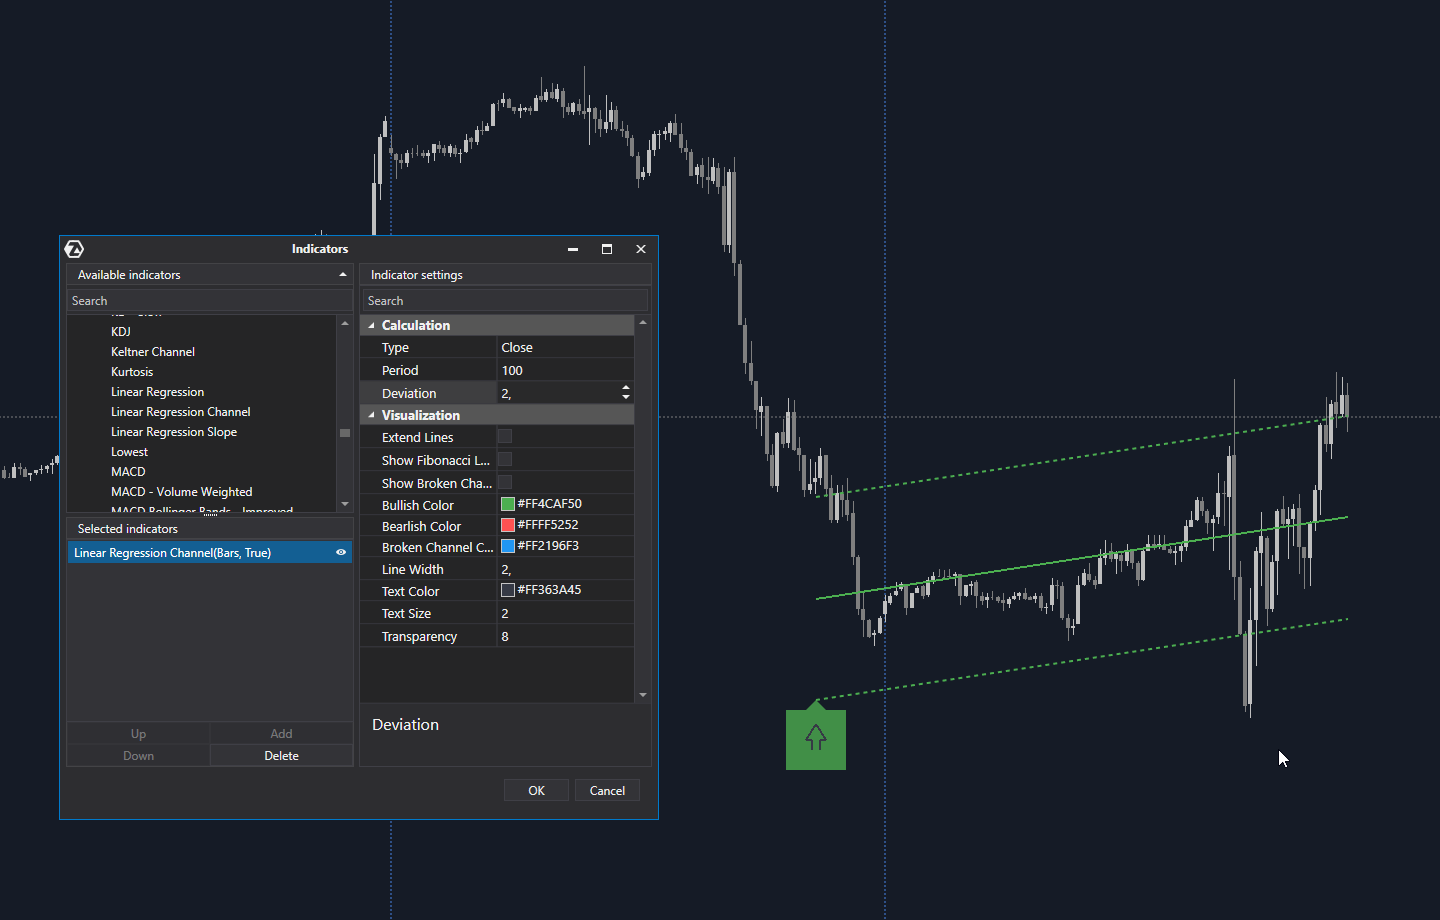
The linear regression channel indicator is interesting, but its parameters don't give you enough freedom because of the period.
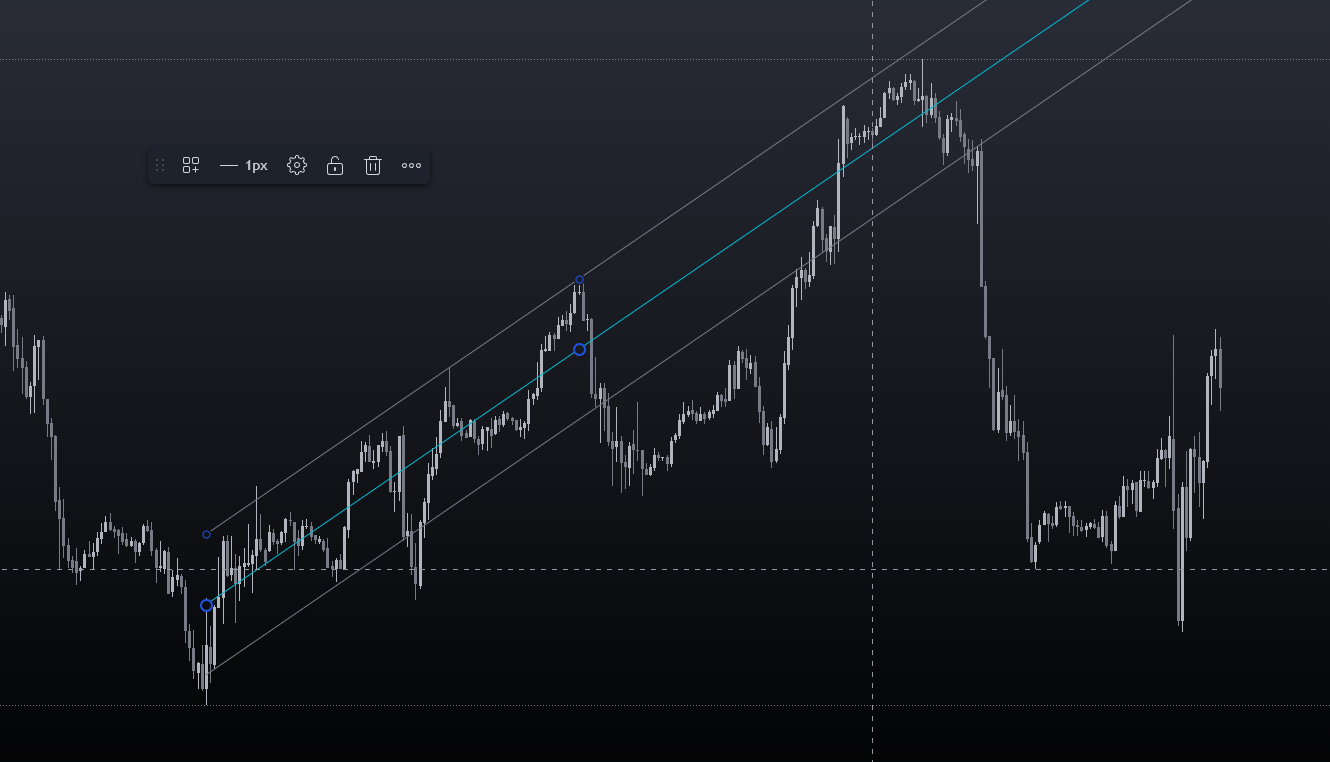
It would be nice to have a drawing tool where you draw the channel by choosing the 2 ends of the regression.
Tradingview has such a tool, and it's very ergonomic.
Log in to comment and vote
Comments2
Vanodga
Aug 28, 2023
Hi!
Maybe our drawing object Channel is what you are looking for?)
Jean-Philippe
Aug 28, 2023
No, a channel is simply a geometric drawing that the trader draws according to subjective rules.
I'm talking about linear regression, a real statistical tool that traces a straight line according to the distribution of the sample (the sample being price variations).
In addition to the regression line, there are 2 other parallel lines corresponding to standard deviations.
As I wrote, there's an indicator in Atas that does this, but it's a sliding indicator, updated every candle according to the period. This is very limiting.
The idea is to be able to plot regressions wherever you want using a drawing tool, just as we can with the volume profile tool.
screen example of a regression