Add ES / NQ Options Heatmap Function

ES / NQ Options Heatmap Function
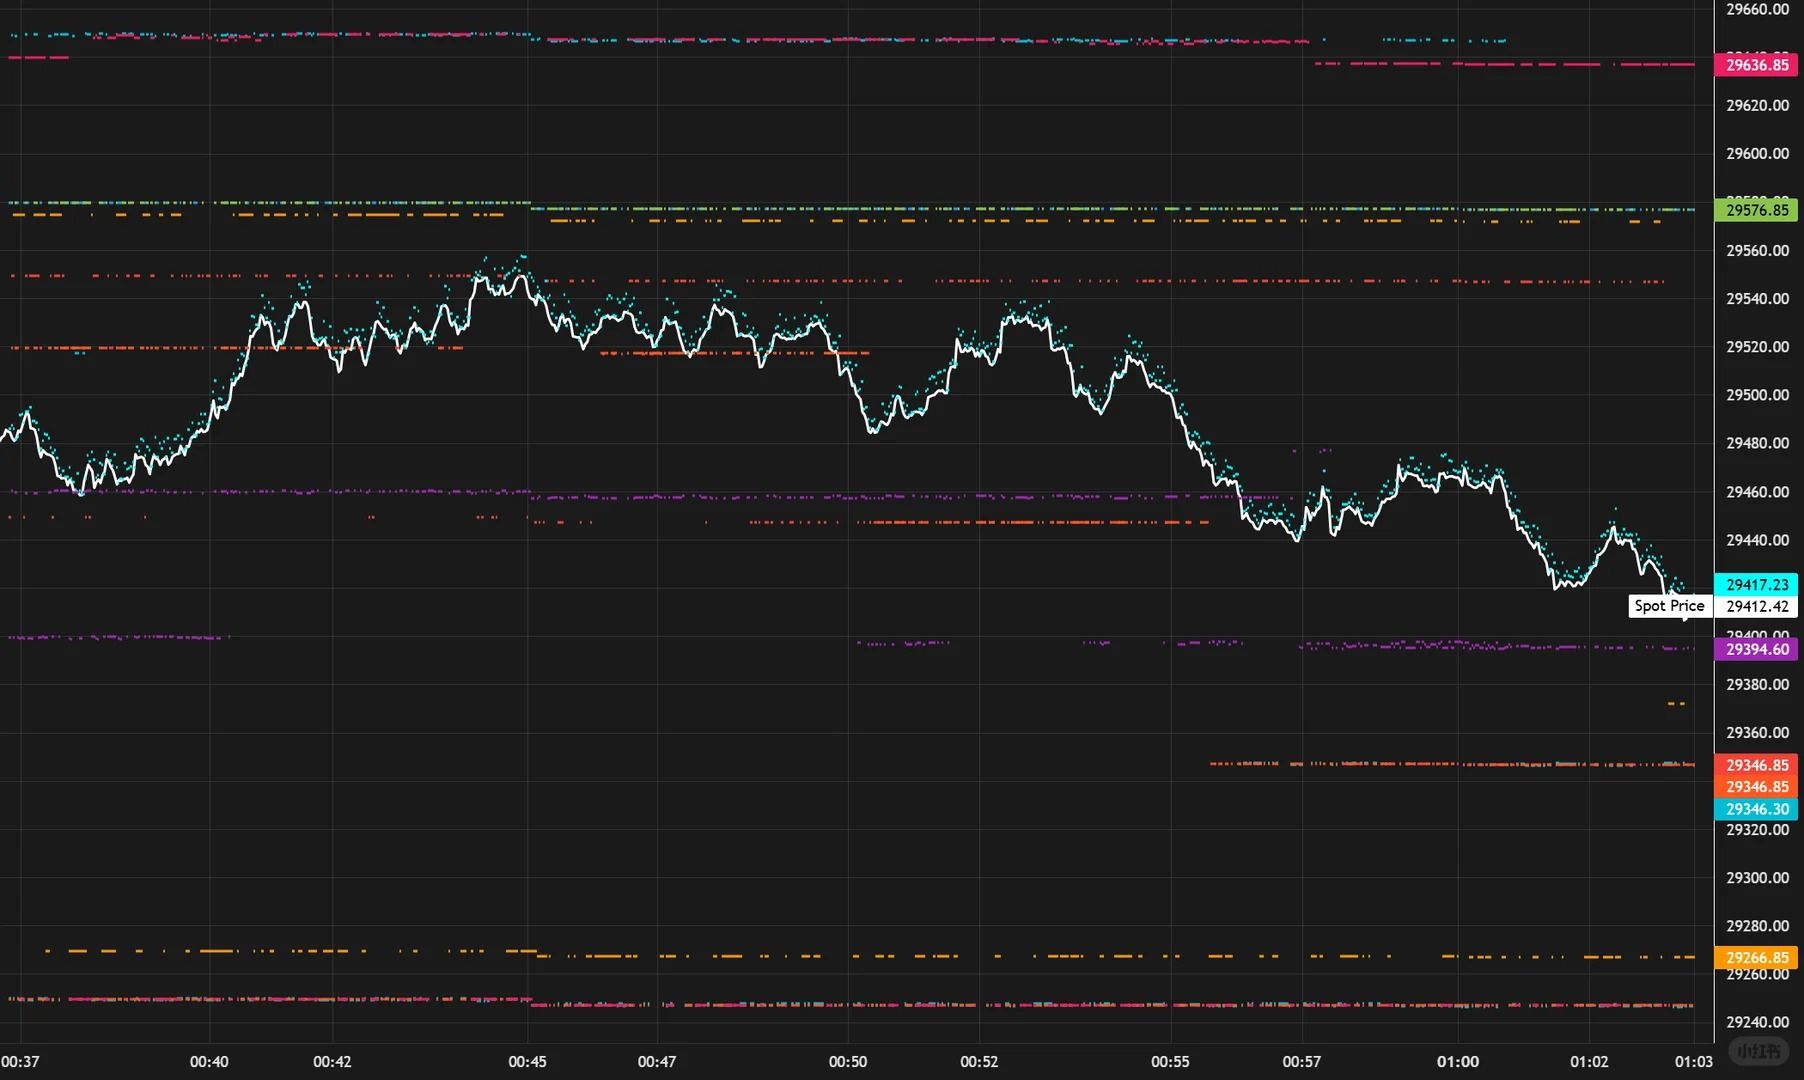
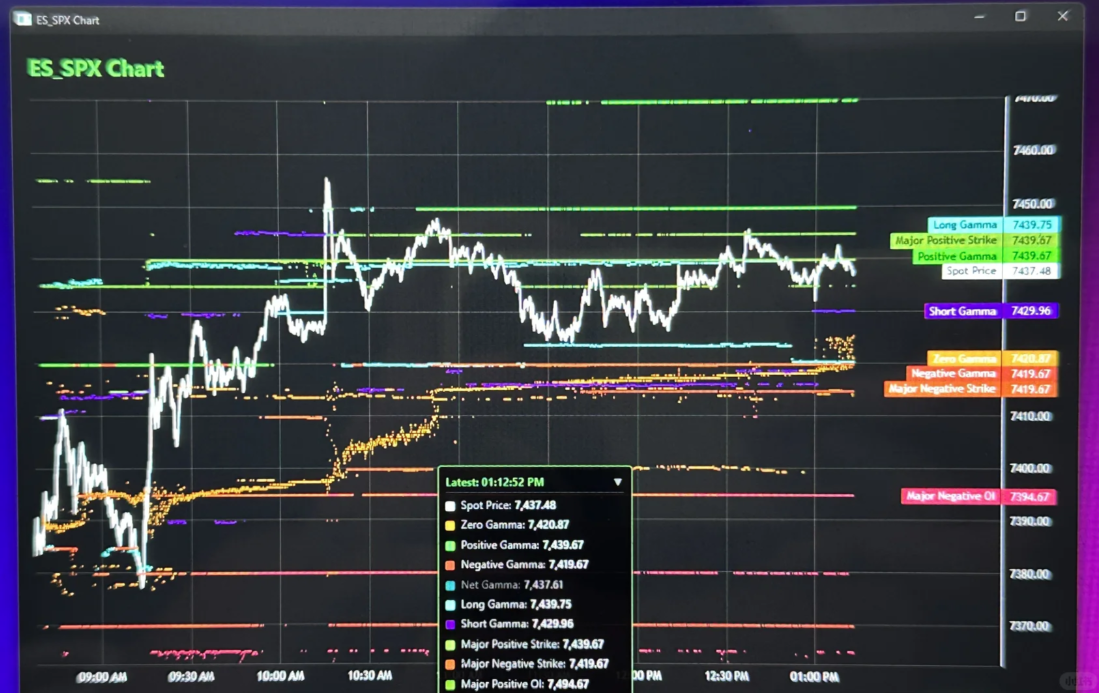
Add an ES / NQ options heatmap feature that displays real-time Gamma footprints directly on the chart, while supporting both static key levels and dynamic key levels.
Static Key Levels
Call Wall
Static reference level for concentrated call option positioning.
Formation Method
Identify representative strike prices based on the concentration of call option positions, then convert them uniformly into corresponding futures contract reference price levels.
Market Meaning
Represents a static price level where call option exposure is relatively concentrated. It may act as an upside target, an attraction zone, or a resistance area requiring validation.
Observation Method
Monitor approach speed, number of repeated tests, volume changes, and whether price shows rejection, breakout, or retest after reaching the level.
Above / Below / Near Price
When current price is below the level, treat it as an upside observation level.
When price is near it, determine whether the market rejects or accepts the level.
After price moves above it, observe whether the retest can hold.
Put Wall
Static reference level for concentrated put option positioning.
Formation Method
Identify representative strike prices based on the concentration of put option positions, then convert them uniformly into corresponding futures contract reference price levels.
Market Meaning
Represents a static price level where put option exposure is relatively concentrated. It may act as a downside target, an attraction zone, or a support area requiring validation.
Observation Method
Monitor downside approach speed, whether absorption appears, repeated breakdown attempts, and whether price continues lower or quickly reclaims the level after breaking it.
Above / Below / Near Price
When current price is above the level, treat it as a downside observation level.
When price is near it, determine whether buyers are absorbing or whether the level is failing.
After a breakdown, observe whether the rebound can reclaim the level.
Balance Line
Static zero Gamma / zero GEX equilibrium reference line.
Formation Method
Determine the balance point where static Gamma exposure changes from positive to negative or from negative to positive, then convert it into the corresponding futures contract reference price.
Market Meaning
Used to observe areas where the static options exposure structure may change characteristics. It is not a directional prediction tool.
Observation Method
First determine whether current price is above or below the level, then observe whether price can hold after crossing and retesting, and whether it aligns with other key levels.
Above / Below / Near Price
When price is trading below it, treat it as an upside structural transition observation level.
When price is near it, expect two-way auction and repeated interaction.
After acceptance above it, interpret the market according to the new structural position.
Volatility Exposure Trigger
Static volatility exposure trigger reference level.
Formation Method
Formed based on areas within the Gamma exposure structure where volatility characteristics may potentially shift, then converted into the corresponding futures contract price level.
Market Meaning
Used to indicate price levels where volatility structure may change. The focus is whether momentum expands or contracts after reaching the level.
Observation Method
Monitor trading speed, candle body size, Delta expansion, and post-breakout continuation to distinguish genuine acceleration from temporary liquidity sweeps.
Above / Below / Near Price
When price is trading on one side of the level, initially treat it as a structural boundary.
When price approaches, focus on volatility regime changes.
After crossing, wait for acceptance or a reclaim failure.
Gamma Exposure Cluster
One or multiple static Gamma exposure concentration zones.
Formation Method
Merge multiple nearby Gamma exposure and positioning concentration levels into one observation cluster. Levels that are sufficiently separated remain displayed individually.
Market Meaning
When multiple options exposure factors concentrate around similar prices, they form a static observation cluster. The denser the overlap, the higher the observation priority.
Observation Method
First identify how many levels exist nearby, then observe whether price slows down inside the cluster, trades sideways, penetrates directly, or accepts through the area layer by layer.
Above / Below / Near Price
A cluster above current price acts as a multi-layer upside observation zone.
A cluster below current price acts as a multi-layer downside observation zone.
When price is inside the cluster, reduce directional conviction.
Long Convexity Exposure
One or multiple static large Gamma / long convexity exposure levels.
Formation Method
Based on concentrated areas of large positive Gamma or long convexity exposure, forming one or multiple static observation price levels.
Market Meaning
Used to observe areas with large Gamma exposure concentration. Price may slow down, become attracted, repeatedly test the area, or continue after acceptance.
Observation Method
Combine approach speed, execution density after reaching the level, Footprint absorption, and whether price can move away from the level afterward.
Above / Below / Near Price
When above current price, observe whether upside movement is absorbed.
When below current price, observe whether downside movement is supported.
When near the level, wait for price selection and confirmation of one side.
0DTE Dynamic Heatmap
Balance Line
Dynamic equilibrium line for same-day expiration option exposure.
Formation Method
Combines same-day expiration Gamma exposure distribution and current price to locate the dynamic equilibrium area where positive and negative exposure transition.
Market Meaning
Indicates the dynamic balance point where the same-day options exposure structure may change characteristics.
Observation Method
Observe whether price maintains acceptance after crossing, whether it clusters with Net Exposure or other areas, and whether the level persists across subsequent snapshots.
Above / Below / Near Price
When price is below it, treat it as an upside structural observation level.
When price is near it, expect two-way auction and competition.
After acceptance above it, interpret the structure according to the new relative position.
Why It Cannot Be Used Mechanically
It moves as 0DTE data refreshes. A single snapshot or one-time cross should not mechanically define bullish or bearish direction.
Applicable Instruments
ES / MES / NQ / MNQ
Positive Exposure Zone
Dynamic area with the highest concentration of positive same-day exposure.
Formation Method
Identifies the price area with the strongest positive exposure concentration from same-day expiration exposure distribution.
Market Meaning
May correspond to a more stable, consolidating, attracting, or repeatedly tested structure, but the meaning depends on actual price reaction.
Observation Method
Observe whether price slows down, trades repeatedly, gets absorbed before leaving, or passes through without hesitation.
Above / Below / Near Price
When above current price, it acts as a potential target or resistance area.
When below current price, it acts as a pullback observation zone.
When price is near it, focus on whether price is attracted or accepted through the area.
Negative Exposure Zone
Dynamic area with the highest concentration of negative same-day exposure.
Formation Method
Identifies the price area with the strongest negative exposure concentration from same-day expiration exposure distribution.
Market Meaning
Highlights areas where volatility expansion, trend continuation, or rapid failure risk may become more likely.
Observation Method
Monitor breakout speed, Delta expansion, whether aggressive buying/selling can continue, and whether price quickly reclaims after penetration.
Above / Below / Near Price
Whether above or below current price, initially treat it as a volatility structure boundary.
When price approaches, reduce anticipation.
After penetration, wait for acceptance or failure confirmation.
Net Exposure
Dynamic reference line for the center of same-day net exposure.
Formation Method
Combines current price and major upside/downside exposure zones to calculate a dynamic center of gravity. If information is insufficient, this line will not be displayed.
Market Meaning
Helps determine the overall bias of the dynamic heatmap structure and whether upside and downside pressure are balanced.
Observation Method
The most important factor is the distance between Net Exposure and Balance Line:
convergence indicates structural concentration;
separation indicates that the dynamic center and equilibrium level are not aligned.
Above / Below / Near Price
When price is trading on one side, treat it as a reference center.
When price approaches, observe whether price is attracted.
After crossing, observe whether the center continues migrating with subsequent snapshots.
Stability Zone
Dynamic area representing relatively stable or long Gamma structure.
Formation Method
Identifies major concentration areas within same-day positive Gamma structures that are more associated with stability and contraction.
Market Meaning
May produce slower price movement, consolidation, attraction, or repeated two-way trading.
Observation Method
Observe whether trading speed decreases, whether Footprint shows two-way absorption, and whether price returns after leaving the area.
Above / Below / Near Price
When above or below current price, treat it as a potential attraction target.
When price enters the area, avoid chasing.
Increase directional confidence only after price exits and accepts outside the zone.
Acceleration Zone
Dynamic area representing acceleration or short Gamma structure.
Formation Method
Identifies major concentration areas within same-day negative Gamma structures where volatility expansion is more likely.
Market Meaning
Indicates that once accepted through, volatility and continuous directional movement may expand more easily.
Observation Method
Monitor breakout candles, aggressive buying/selling, Delta, and whether retests support continuation.
Above / Below / Near Price
When price approaches, wait for directional selection first.
After price moves above or below the zone, only continued trading outside the area confirms acceptance.
Upside Pressure Anchor
Main upside pressure or attraction anchor.
Formation Method
Identifies the most important upside concentration level from the same-day exposure distribution above current price.
Market Meaning
Used to locate upside targets, pressure areas, or repeated test levels that deserve higher attention.
Observation Method
Observe whether price is attracted upward, whether sellers absorb at the level, and whether price can hold after breaking above.
Above / Below / Near Price
When above current price, it acts as an upside observation anchor.
When below current price, it becomes a pullback reference.
When nearby, determine whether it acts as resistance or acceptance.
Downside Pressure Anchor
Main downside pressure or attraction anchor.
Formation Method
Identifies the most important downside concentration level from the same-day exposure distribution below current price.
Market Meaning
Used to locate downside targets, support areas, or repeated test levels that deserve higher attention.
Observation Method
Observe whether price is attracted downward, whether buyers absorb at the level, and whether a rebound can reclaim the level after breakdown.
Above / Below / Near Price
When below current price, it acts as a downside observation anchor.
When above current price, it becomes a rebound reference.
When nearby, determine whether buyers are supporting or whether price accepts below.
Position-Weighted Upside Anchor
Upside dynamic anchor weighted by positioning concentration.
Formation Method
Combines upside exposure strength and positioning concentration to form a dynamic anchor with higher position-weighted importance.
Market Meaning
Emphasizes upside positioning concentration. When it overlaps with a normal Upside Anchor, the observation priority becomes higher.
Observation Method
First check whether it overlaps with other upside levels, then observe execution volume at the level, seller absorption, and whether price can hold after breakout.
Above / Below / Near Price
When above current price, it acts as a position-weighted upside target/resistance observation level.
When below current price, observe whether the pullback can hold.
When nearby, focus on confluence between multiple levels.
Position-Weighted Downside Anchor
Downside dynamic anchor weighted by positioning concentration.
Formation Method
Combines downside exposure strength and positioning concentration to form a dynamic anchor with higher position-weighted importance.
Market Meaning
Emphasizes downside positioning concentration. When it overlaps with a normal Downside Anchor, the observation priority becomes higher.
Observation Method
First check whether it overlaps with other downside levels, then observe execution volume at the level, buyer absorption, and whether breakdown continues.
Above / Below / Near Price
When below current price, it acts as a position-weighted downside target/support observation level.
When above current price, observe whether a rebound can reclaim the level.
When nearby, focus on confluence between multiple levels.
Intraday Reading Sequence
1. Locate Current Price and the Nearest Upper / Lower Boundaries
First identify the nearest upside line / highlighted zone and downside line / highlighted zone from current price, and record the distance.
Do not force an interpretation when price is located in the middle without nearby boundaries.
2. Check Level Clustering and Overlap
Check whether static levels, dynamic levels, and multiple anchors are concentrated within similar price areas.
Overlap increases observation priority, but do not artificially combine widely separated levels into one point.
3. Classify the Reaction as Touch, Rejection, Breakout, or Acceptance
A touch only means price has reached the level.
A rejection requires price to move away and continue.
A breakout only means price has crossed through.
Acceptance requires continued trading on the other side and successful retesting.
Classify the price behavior first, then evaluate direction.
4. Use Order Flow to Confirm What Is Happening
Combine volume, Footprint, Delta, aggressive buying/selling, and absorption to determine who is initiating movement and who is providing liquidity.
The levels tell you where to watch.
Order flow tells you what is happening there.
5. Check Snapshot Persistence and Market Context
Confirm whether dynamic zones remain present in subsequent 10-second snapshots.
Also combine:
trend conditions
opening gaps
event timing
static key levels
Short-lived zones that appear and disappear quickly should receive lower weighting.
6. Define Invalidations Before Deciding to Trade
Clearly define:
what price behavior invalidates the idea
what order flow change invalidates the idea
what time delay invalidates the idea
Then decide entry, position size, and exit.
Without clear confirmation or invalidation conditions, do not trade.
Recommended Settings
Display Priority When There Are Too Many Lines
1. Start With Only Four Core Lines
Keep:
Balance Line
Positive Exposure Zone
Negative Exposure Zone
Net Exposure
Use them first to determine:
current price location
structural center of gravity
major upside/downside observation zones
2. Add Rhythm Lines When Needed
When determining whether the market is consolidating or accelerating, enable:
Stability Zone
Acceleration Zone
If the chart becomes too crowded, prioritize turning off labels and keeping only the colored zones.
3. Add Anchor Lines Last
Only enable the four Anchor lines when:
searching for upside/downside targets
identifying attraction zones
conducting review analysis
If anchors overlap with core zones, the price area becomes more important due to confluence.
4. Heatmap Continuously Updates Inside Candles
The heatmap updates continuously according to intraday snapshots.
Multiple changes may occur within the same candle and continue into the next update.
Therefore, it represents a continuous intraday trajectory rather than a single point per candle.
Heatmap Display Settings
Heatmap Toggle Enabled
Enable the heatmap during first use.
Confirm that the chart displays the heat zones correctly, then adjust transparency and window settings according to preference.
Display Window: 15–30 Minutes
If the chart becomes too crowded, use 15 minutes.
To view a more complete intraday path, use 30 minutes or longer.
This setting only affects visual display and does not delete locally stored historical data.
Medium-to-Low Transparency
Keep candlesticks clearer than the heatmap.
The heatmap is background information and should not cover price action.
Labels Display as Needed
Enable labels during review or educational use.
During live trading, if text blocks the chart, display only the heatmap zones without labels.
thanks!
Status: Completed
Log in to comment and vote
No comments yet
Be the first to share your thoughts.