July 2nd, 2026
Latest 8.0.14
🚀 Key updates
Heatmap (Beta) Indicators
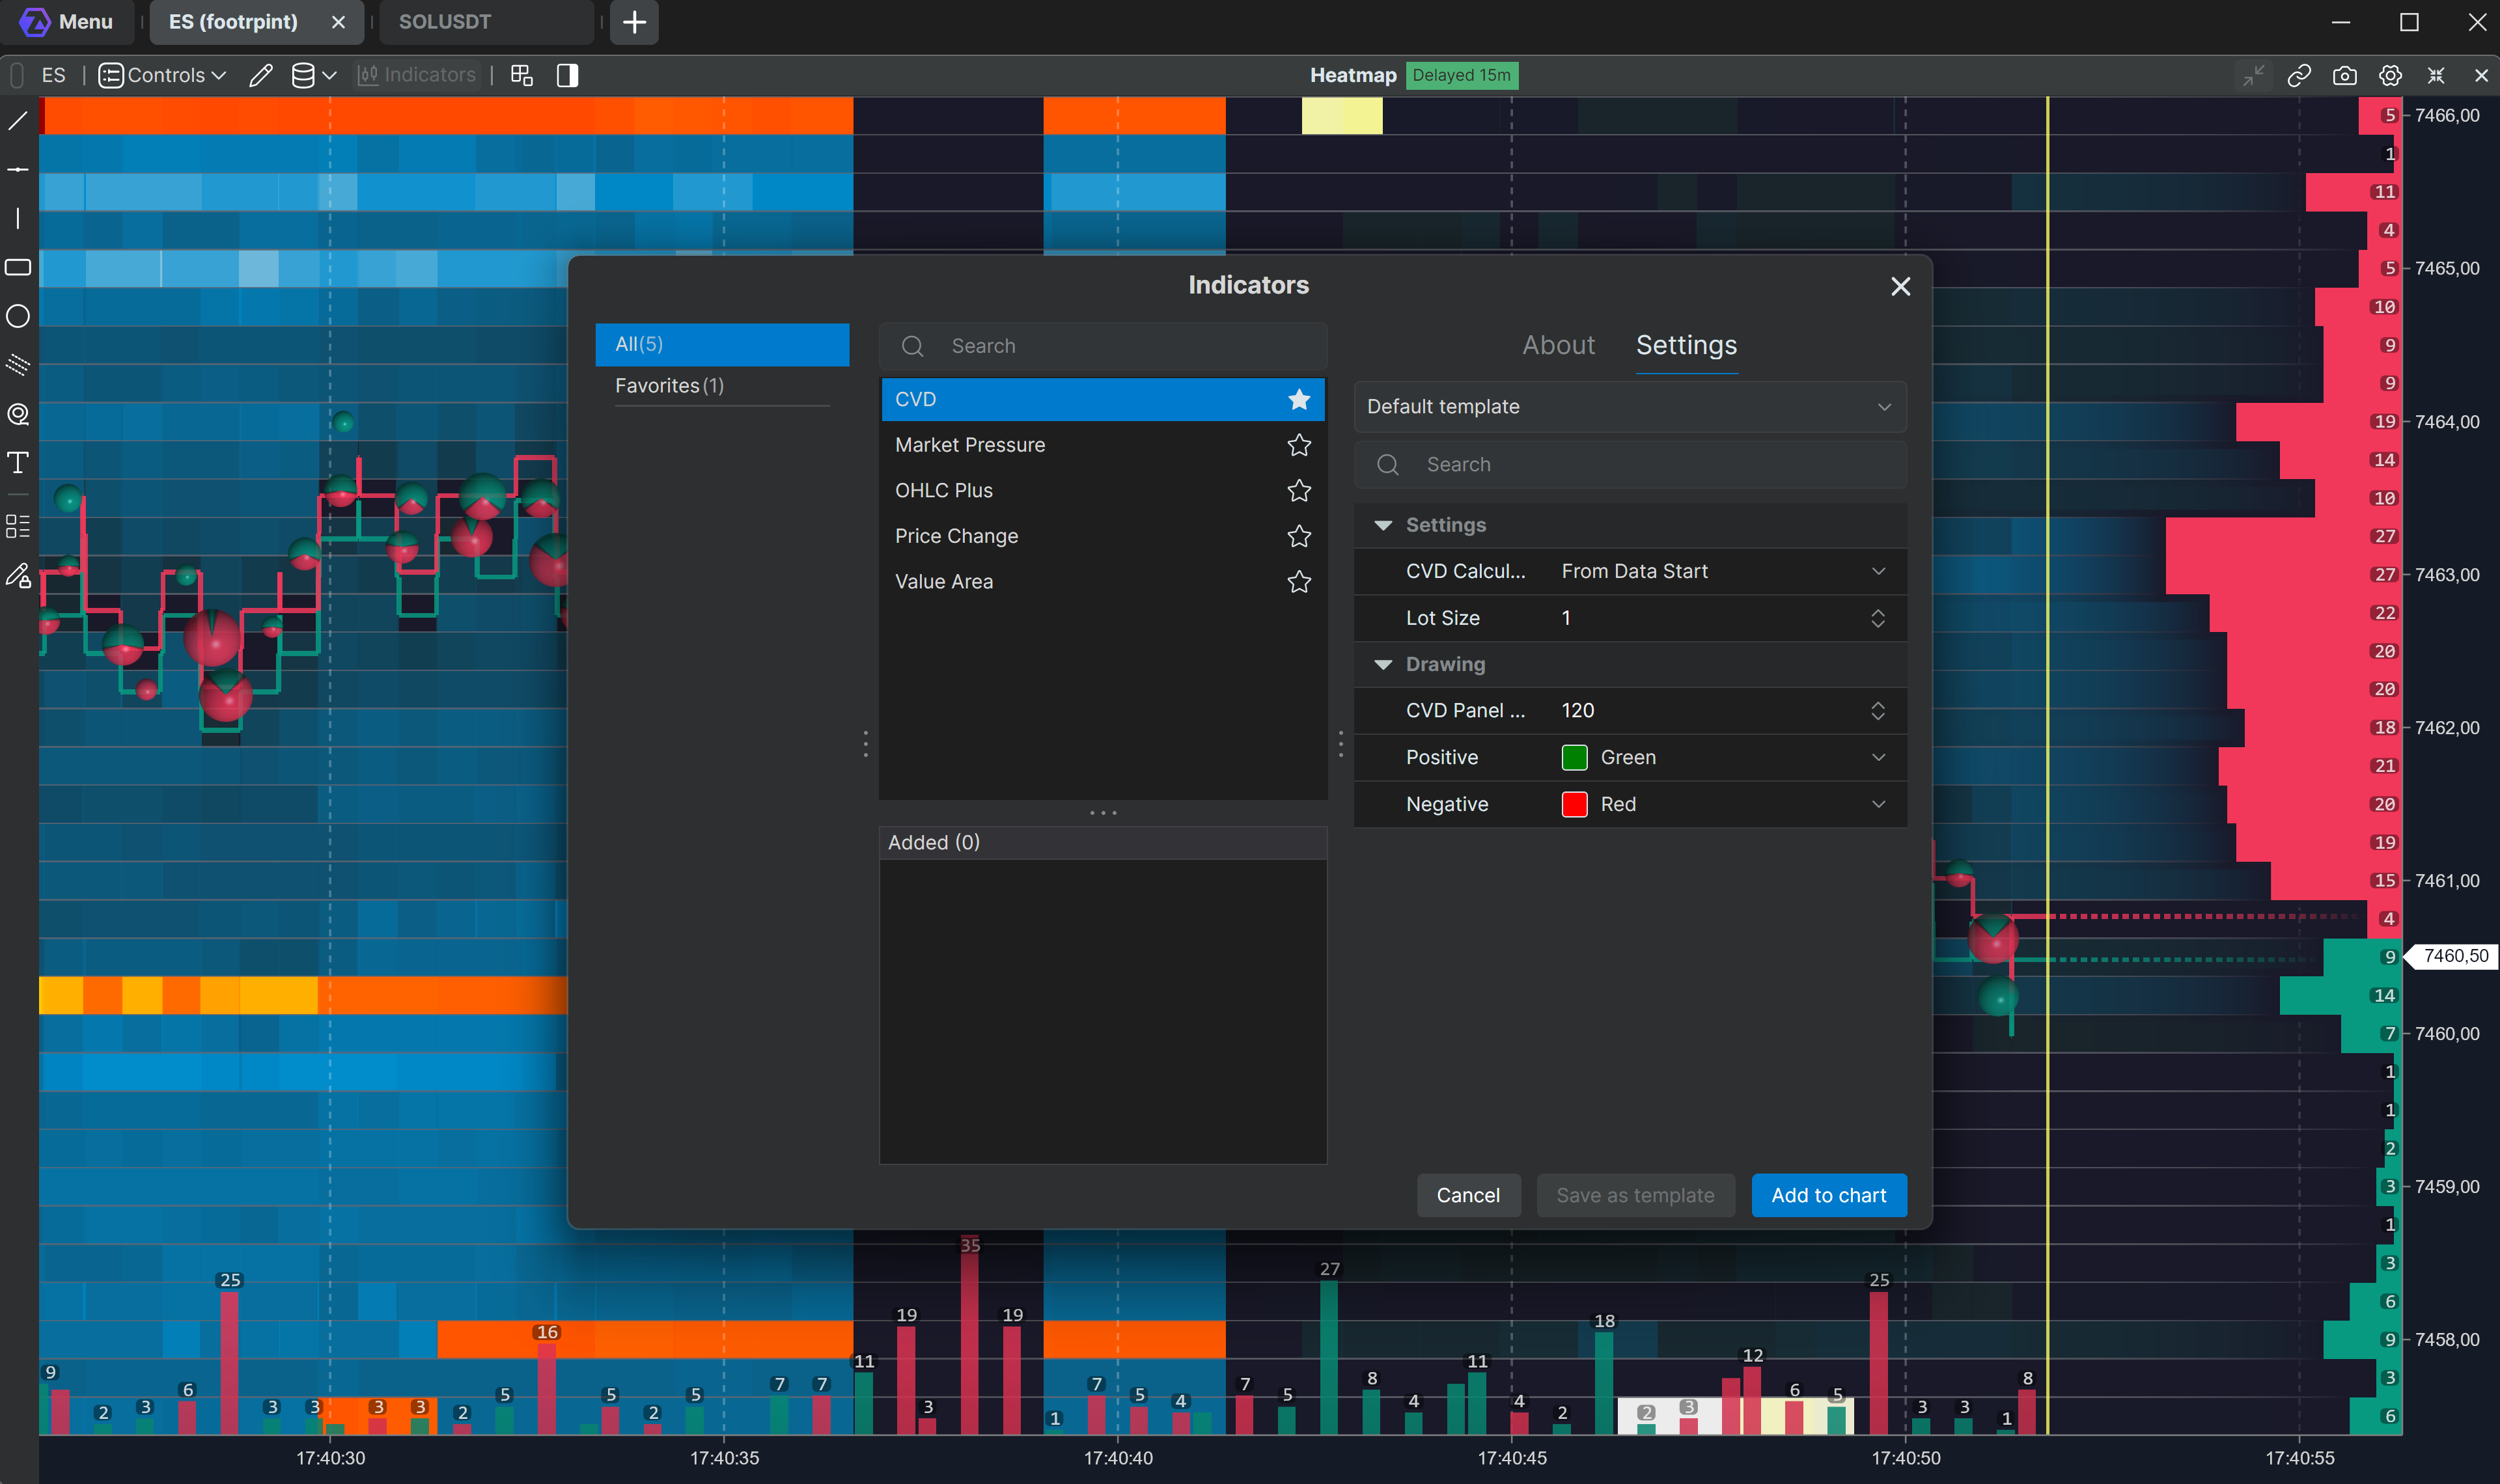
CVD, Market Pressure, Price Change, OHLC Plus, and Value Area — popular analysis tools — are now available directly in the liquidity analysis module.
New indicators
VWMA — Volume Weighted Moving Average.
It accounts not only for price, but also for the volume of each candle: periods with higher activity get a larger weight in the calculation:
VWMA = Σ(Volume × Price) / Σ(Volume) over N bars
Helps distinguish moves confirmed by volume from low-activity noise.
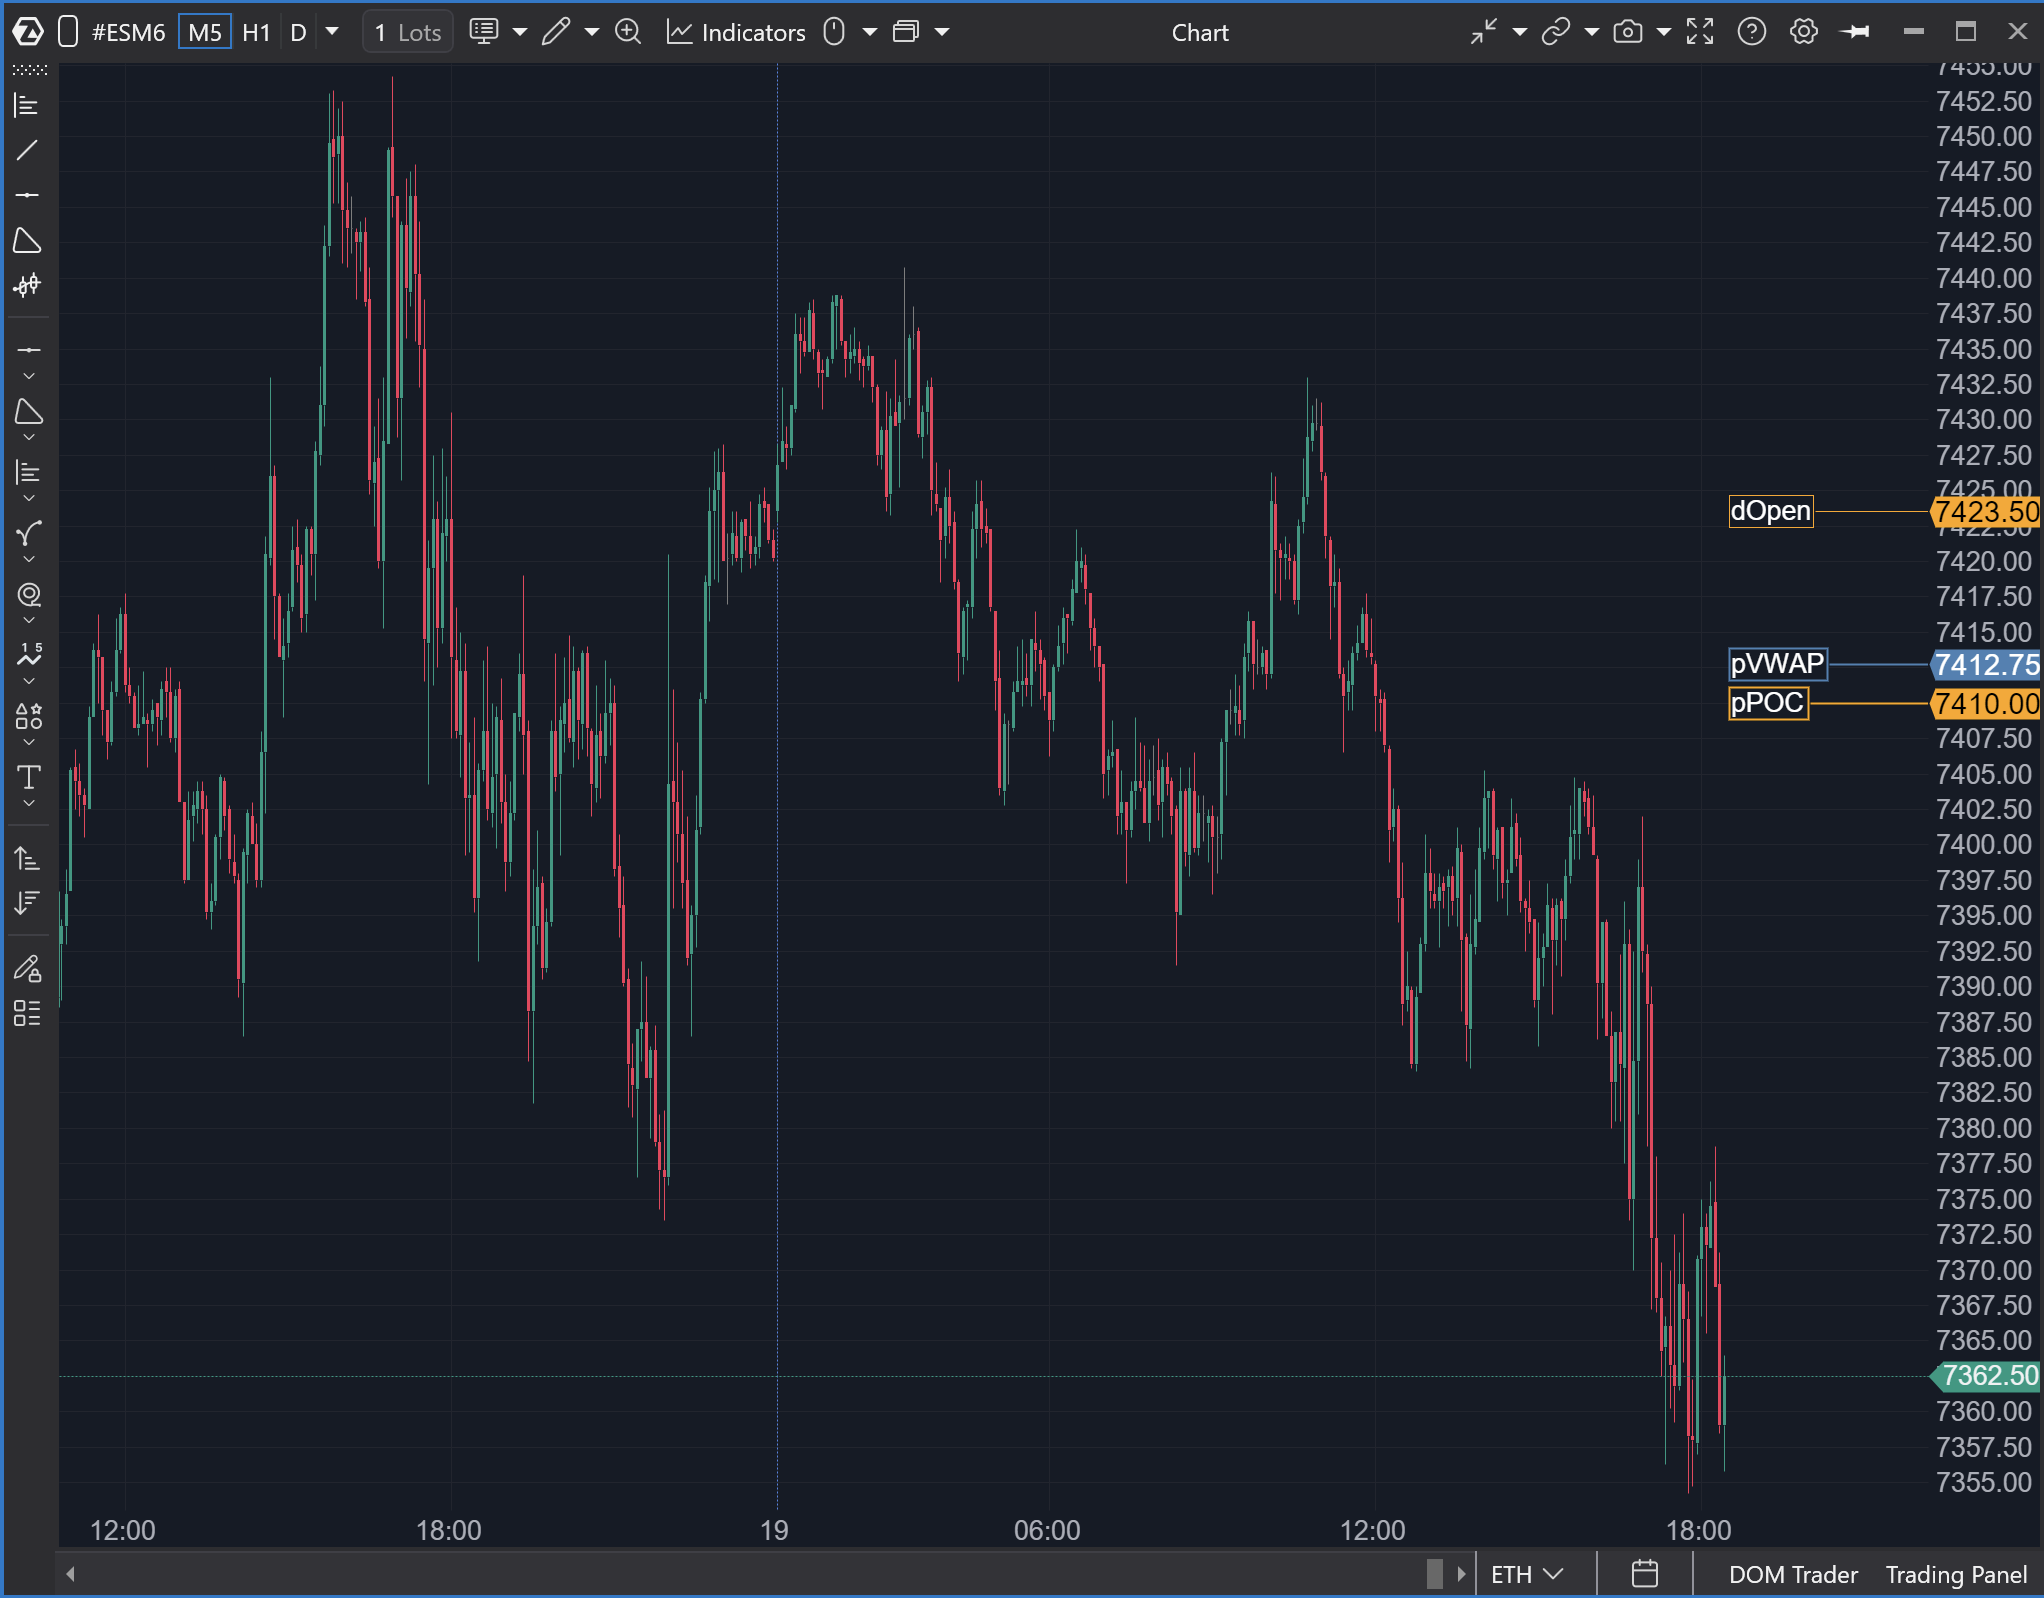
OHLCPlus — an indicator that plots key levels for selected periods: Open, High, Low, Close, plus additional levels like Equilibrium, POC, VWAP, VAH, and VAL.
Helps quickly see important reference points for the current and previous day, week, month, and contract period. Users can enable only the needed levels, customize color/style/line thickness, show/hide price labels, and adjust label placement.
Updated Indicator Manager
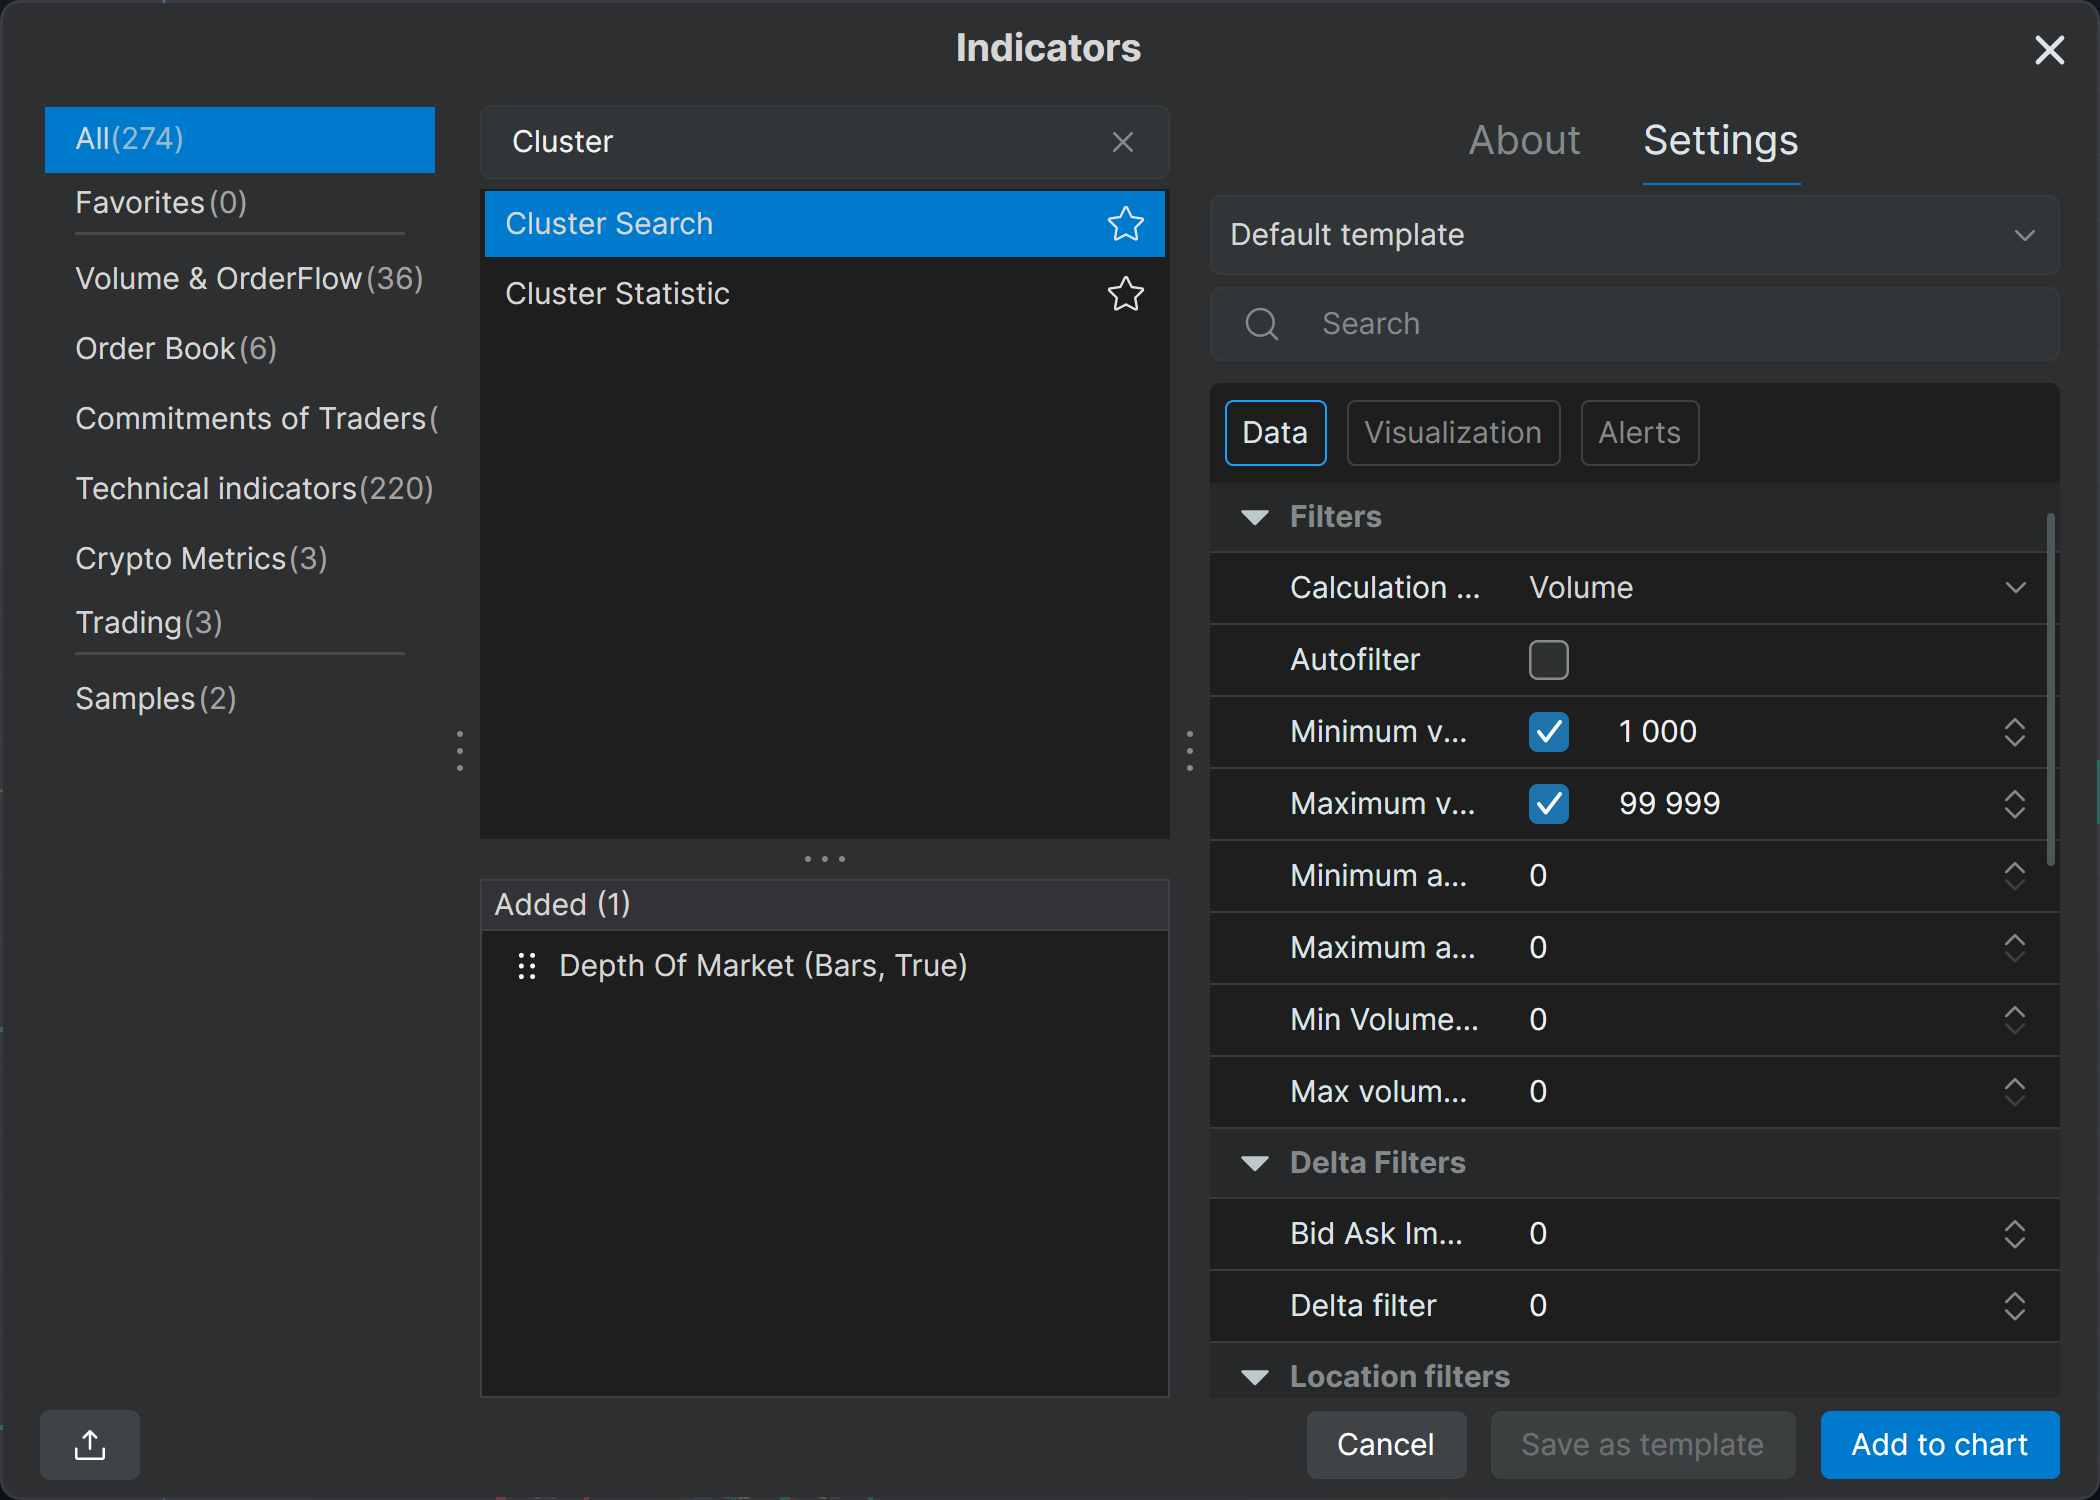
The settings panel now includes Data, Visualization, and Alerts tabs (the set depends on the options available for a specific indicator). Clicking the badge takes you straight to the corresponding settings section.
Works for: CVD, CVD Pro, Bar Timer, Delta, Cluster Search, VWAP/TWAP, Volume, Big Trades, Stacked Imbalance, Cluster Statistics, Volume Profile & TPO.
Volume Profile
Market Profile & TPO has been renamed to Volume Profile & TPO.
Previously, TPO levels were shown only with triangles. Now you can choose a clearer display — triangles, square highlighting, or both at once.
With the Width (% of area) slider you can set an exact profile width manually (first disable auto proportions). The same manual proportions are available for ZigZag, markers, and letters in TPO mode.
In delta display mode, the histogram is now built strictly from the start of the selected period, not from the center as before.
Big Trades
Smart auto-filter: previously it was just on/off; now you can set sensitivity levels Weak / Medium / Strong.
Overload protection: with auto-filter off and Minimum Volume set too low, a hint appears about too many small trades. This helps optimize settings and avoid system overload.
Zones — a new level mode. From each Big Trades mark on the chart you can build horizontal lines:
for all trades, trades in the candle body, or in wicks;
for all candles, trend candles, or reversal candles (when building from the body);
zone lines can extend to the end of the screen or for a specified number of candles ahead.
Optimized Linking
You can now sync multiple charts by the price axis. As soon as you zoom or move one chart, the others adjust automatically. Linking works for any number of charts of the same ticker within one workspace.
Watchlist
Added buttons for editing the list, removing tickers, and filtering.
Added presets. By default, ready-made lists TOP 10 US Futures and BinanceFutures_USDT are available with editing support. You can also build and customize lists from scratch for different sessions or strategies.
Drag-and-drop: drag any ticker from Watchlist directly onto a chart or DOM to open it instantly. Works in reverse too: drag an instrument from the chart/DOM to quickly add it to Watchlist.
Trading Sessions Customization
Custom trading sessions can now be renamed and deleted in a couple of clicks. All created custom sessions become available automatically in Smart DOM → Sessions column.
Cross-Trading
Added support for trading CFD instruments.
New ZQ Instrument and Improved Ticker Search
In US Futures, ZQ is now available — a 30-day Federal Funds rate futures contract.
Favorite tickers are shown by default when opening the window — the most important instruments are immediately at hand.
Improved search algorithm: full matches are shown first, then partial matches. No more confusion with similar codes.
Ticker search works even if the symbol name is typed in the wrong keyboard layout.
Dynamic groups: categories in the left menu now adapt to the query and show the groups that match the current search results.
💻 Analytics Platform
The login window now always opens on the main monitor.
Authorization respects the saved server.
Custom modules: installing/hiding modules applies immediately (no need to click Apply).
Automatic creation and connection of market data connectors for crypto instruments when opening a chart.
Fixed connector display in the bottom panel — now placed correctly and hidden in a submenu.
Added a warning icon for offline accounts with a tooltip on hover.
Fixed missing data loading after waking from sleep mode.Fixed an issue where the app failed to start after switching between Beta and Stable versions.
Disabled migration of old settings from the Documents folder.
Fixed freezes when opening a workspace and when updating stats for new trades.
Fixed data loading errors when refreshing a chart.
Optimized processing of large numbers of cumulative trades.
Fixed the open-instruments counter when switching instruments.
Fixed panel flickering when changing color theme.
Fixed a crash on startup for users in UTC+02:00 Cairo.
Fixed language checkmark display on startup and when switching languages.
Fixed endless error logging in the webhook notifier for alerts.
Improved login window design.
Updated the Privacy Policy link in the About section.
🔥 Heatmap (Beta)
Drawing objects
The drawing toolbar is now global. When docking linked modules (e.g., Heatmap with multiple charts), you can keep it visible in one window and hide it in others. You can also drag it to any place on the screen. Drawing tools will work across all modules.
Drawing objects now work in 3D mode.
3D mode
The “current moment” line is now rendered as a fading vertical plane.
Fixed tooltips.
Fixed price input.
Fixed Bubbles display for stocks.
Fixed charts on dxFeed Delayed.
Fixed scrolling when level display is disabled.
Fixed inverted Split color scheme.
When docking, the window no longer drops behind other windows.
Fixed SL/TP warnings.
Fixed incorrect template behavior.
Improved rendering.
📈 Chart
Added gradient proportionality setting for the visible footprint-chart area.
Fixed OrderFlow chart building.
Line charts now show gaps between sessions for a clear separation of trading activity periods.
In addition to synced zoom/scroll, fixed base Y-axis scaling — linear scaling replaced with exponential.
Quick markup: right-click the price scale to add a line. By default, it spans to the opposite edge of the screen, but gets cut to a ray when it intersects the first candle.
Chart templates can now be applied with a double click.
Fixed duplicated timeframes in chart settings.
Chart toolbar is now more compact and matches the Heatmap toolbar height.
Switching instruments is blocked during data loading (via button or drag-and-drop) to prevent an empty chart during history loading.
Fixed handling of empty candles and DateTime overflow on the time axis.
Optimized context menu placement after closing nested dialogs.
Fixed labels in the toolbar for the footprint dropdown and custom timeframes.
Delay indicator colors can now be configured both on the chart and on the heatmap; colors are unified.
Fixed a crash due to Direct2D cache eviction on Rithmic charts.
Fixed RTH session schedule for Interest Rate Futures and Agricultural Futures.
⚙️ Indicators
Cluster Search: removed redundant recursive recalculation when loading the workspace.
Adaptive Big Trades: added alerts support.
Depth of Market: added Pulling and Stacking detection.
DOM Levels: fixed data mismatch before/after update with real-time dxFeed connection enabled.
Tape Pattern: fixed settings window freezing.
VWAP: custom session fields are disabled unless the Custom period is selected.
Crypto Open Interest: fixed real-time candle updates.
Volume Index Average: fixed incorrect tooltips for TextColor and DrawBg.
Volume On The Chart: indicator is now drawn above other objects on the chart.
Session Colors: now supports saving multiple sessions at once.
Optimized Market Profiles, Cluster Search, OrderBookAlerts, FairValueGap, and Price Change/Market Pressure widgets.
Fixed behavior of “Save as template” in indicator settings.
Fixed tab highlighting when switching indicator templates.
Fixed missing image on the About tab when opened from the legend context menu.
📊 Smart DOM
Restored Rithmic and dxFeed connection indicators in the status bar.
Fixed Int32 overflow when switching instruments during workspace loading.
Fixed context menu appearing simultaneously with order placement via right click.
Fixed private mode: account name is now hidden.
🧮 SmartTape
Fixed switching instruments when adding to an existing color group.
Fixed incorrect UTC time conversion for Ask when using dxFeed connector.
✏️ Drawing Objects
You can specify on which timeframes drawing objects are visible, and on which they auto-hide. Settings can be saved as templates.
Added Favorites button. Tools and templates can be marked as favorites and pinned to the quick access toolbar.
Quick access toolbar
Now global: can be enabled in one chart and disabled in others to save space and reduce visual noise; can be dragged anywhere in the workspace. You can draw from one panel across all charts, including Heatmap (Beta).
Drawing groups and individual tools can be removed from the quick access toolbar; they remain available in the top dropdown menu.
Icon size and toolbar width are now configurable.
Favorite templates and objects show their real appearance (e.g., a yellow line shows as a yellow line icon).
Market Profile & TPO
Renamed to Volume Profile & TPO.
All improvements described above for Volume Profile & TPO are also implemented for the drawing object.
Profile/TPO custom period boundary markers are now hidden when Lock is enabled.
Border visualization mode is preserved when vertically compressing the chart.
In TPO mode, period open/close markers were added for convenience.
The profile can be moved by dragging the histogram.
Delta Profile. Zero line aligned to the start of the period.
Fibo Extensions. Fixed label overlap on high-DPI monitors.
Line thickness. Line thickness now accounts for monitor scaling (DPI).
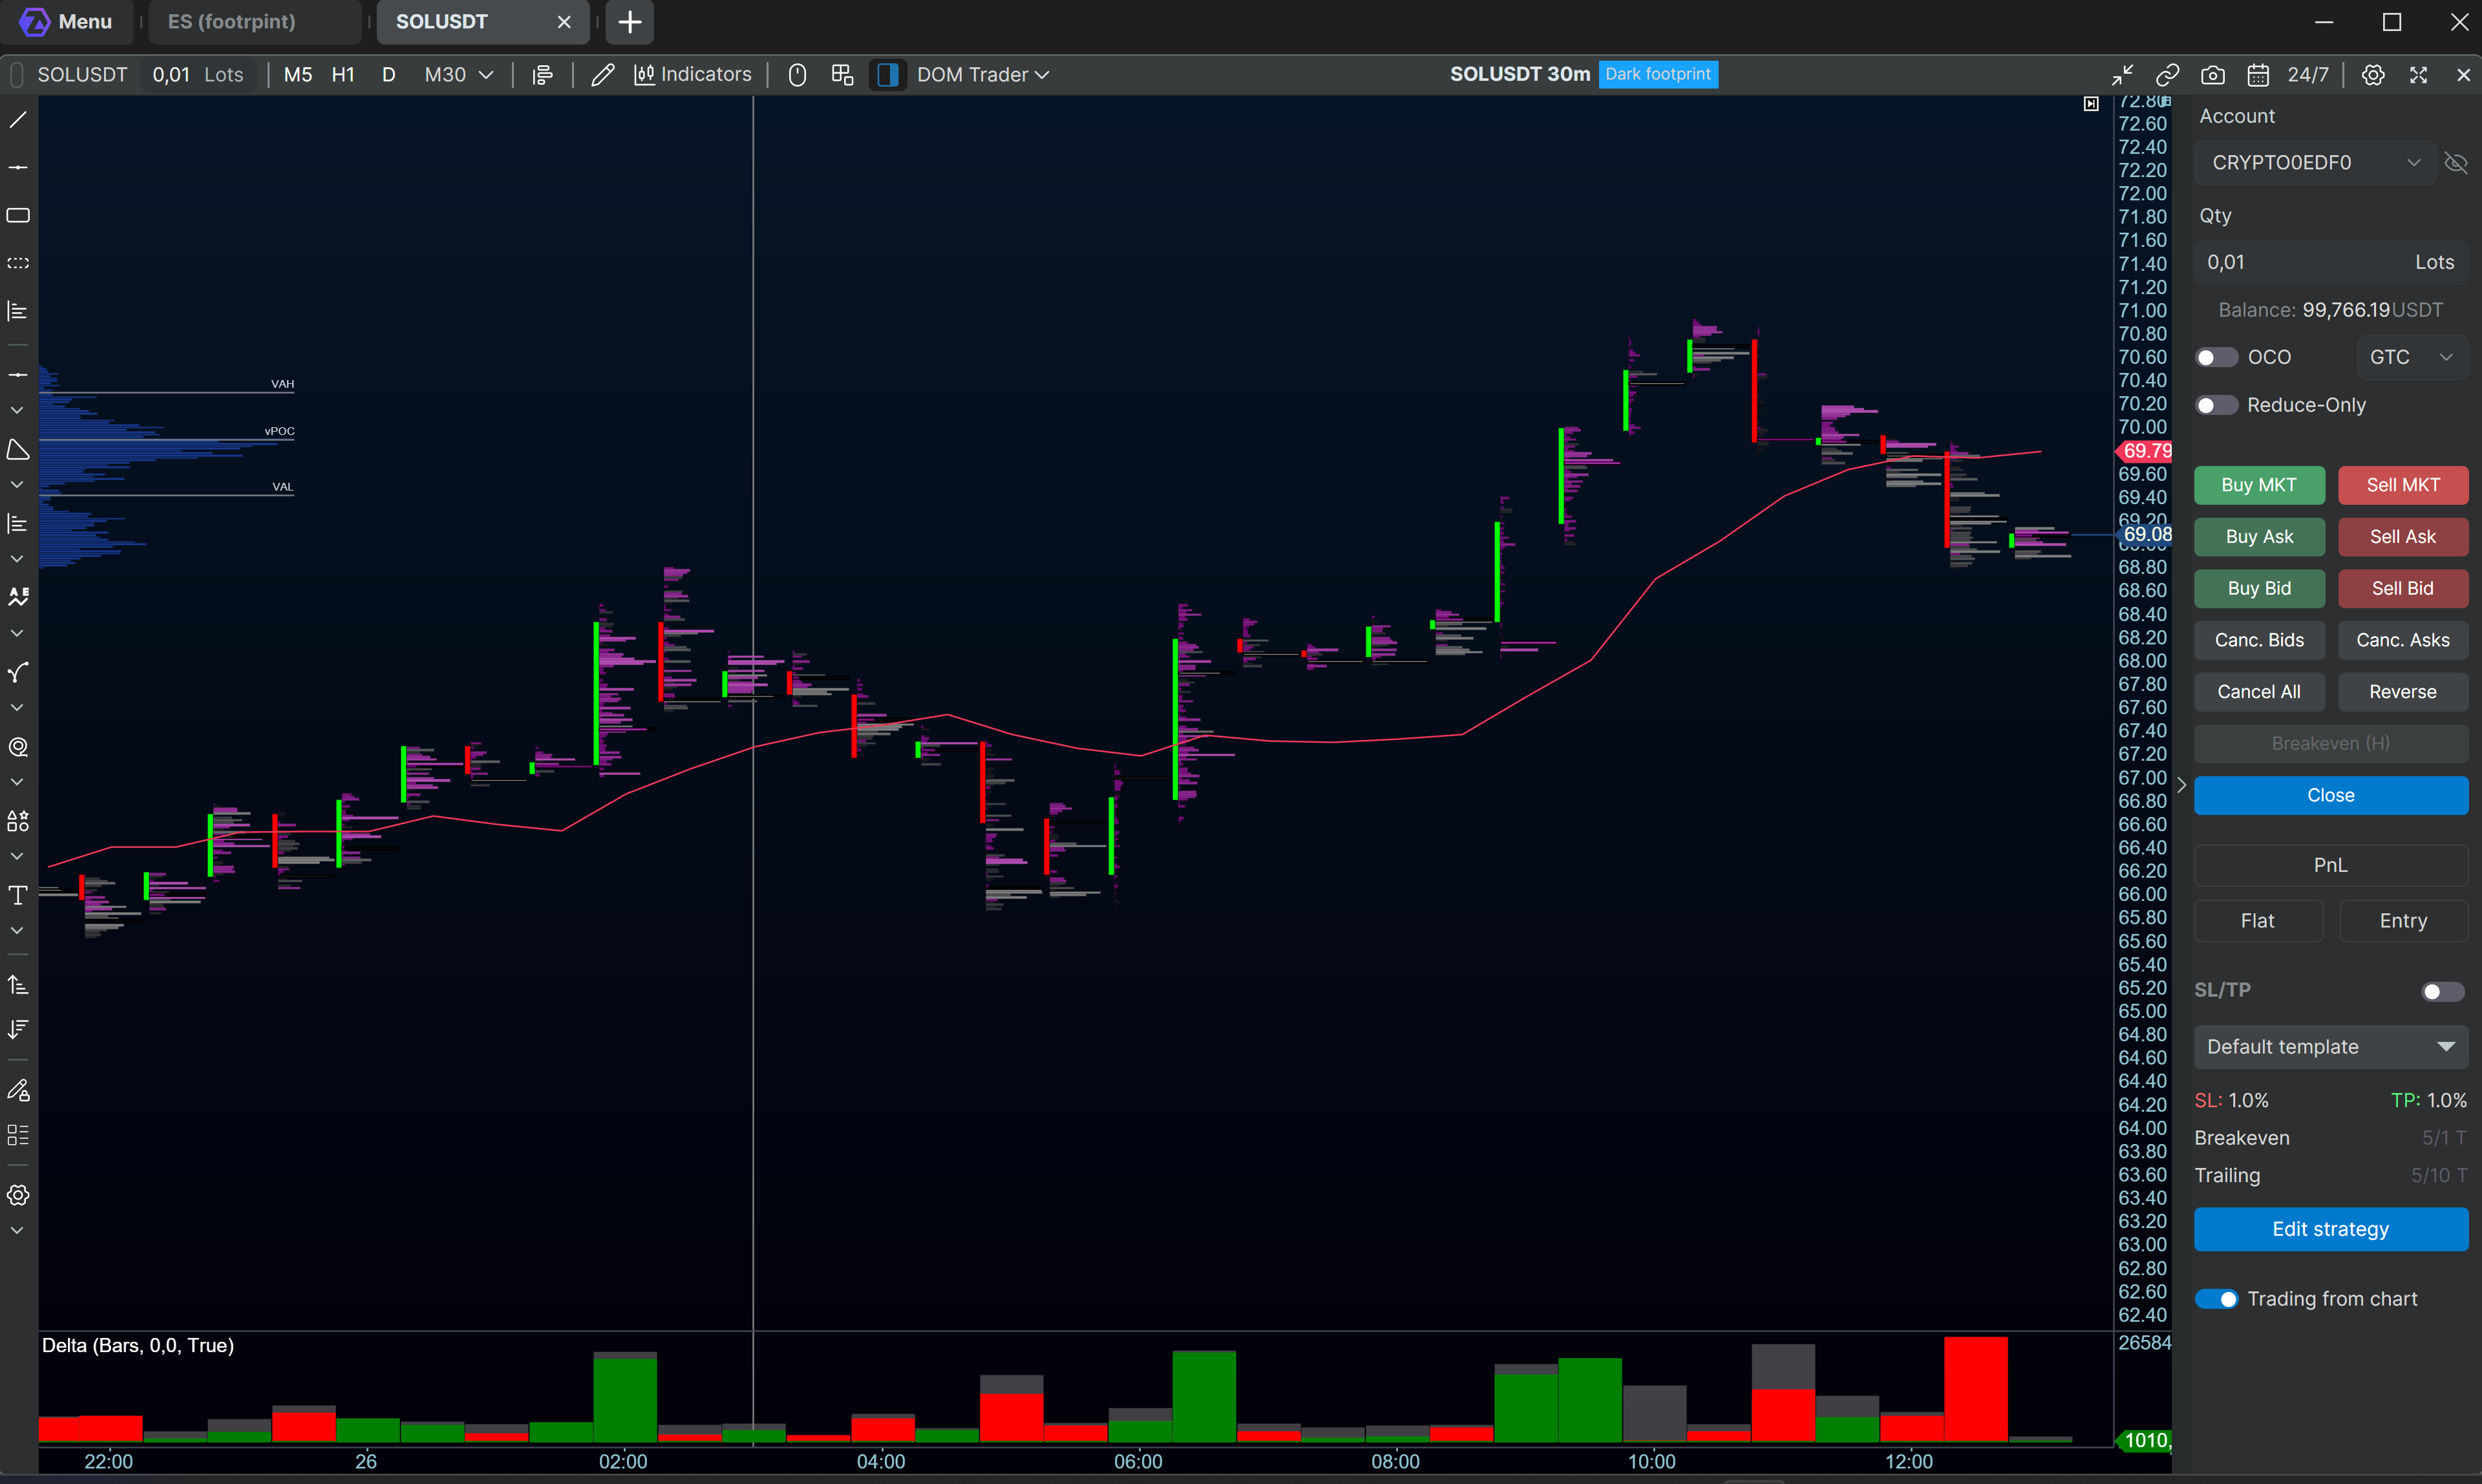
💸 Independent Order Management
Trading Panel:
Title stickers are hidden if no instrument data is available.
Fixed default selection of an offline account that is not in the accounts list.
Trading strategies on the chart now continue working after connector reconnection.
Fixed automatic adding of the Cross Trading Best Price indicator.
🛡 Exit Strategies (SL/TP)
Added templates for Simple and Multi-level SL/TP strategies. When a new template is activated, all orders are instantly re-submitted in real time.
When reducing a position, reduce-only orders are now resubmitted with reduced volume.
Fixed SL/TP order colors in Smart DOM — now fully match chart behavior.
Fixed an error when tick size is zero.
▶️ Replay
Switching instruments is blocked while replay is active.
Fixed enabling replay after closing the instrument selection window.
Fixed date display in the “no data” tooltip — now respects the computer’s date format.
Fixed custom filter behavior in the properties table.
In fast replay mode, Market Profile alerts for VAH/VAL/POC touches now go through AlertManager to limit the flow.
When replay is active, the Heatmap (Beta) button becomes inactive.
✅ Following Manager
Fixed waiting for follower position changes.
Unified behavior for order types.
📂 Trading Journal
Added text wrapping in journal comment fields and playbook descriptions.
Added date range validation in the stats filter.
Fixed cursor behavior at day boundaries in the stats calendar.
Hid the technical “Is Initialized” flag in the create/edit trade dialog.
Fixed declension/wording for “Trades” and “Days” in the trading calendar.
🔗 Connectors
dxFeed
Added support for DPrimeVU and DataFeed Prime connections.
Fixed “Connection does not exist” error on reconnect.
Fixed high memory usage and freezes with multiple charts.
Fixed incorrect order book handling: constant depth limiting, missing quotes for stocks with combined connections.
Fixed futures contract months.
Fixed time zone display for US stocks.
dxFeed delayed: fixed missing history for the current day.
dxFeed prop: fixed order times.
CQG: added support for ZQ (30-Day Federal Funds Futures).
AMP/CQG: added an extra help link in the connector description.
MT5: added automatic FillingMode selection when placing orders.
Crypto data: restored ability to add a connector manually.
Exante: fixed freezing when connecting with invalid data.
Bitmex: fixed reconnect errors.
NinjaTrader: fixed missing orders when flattening a position.
Transaq: fixed the link in the connector description.