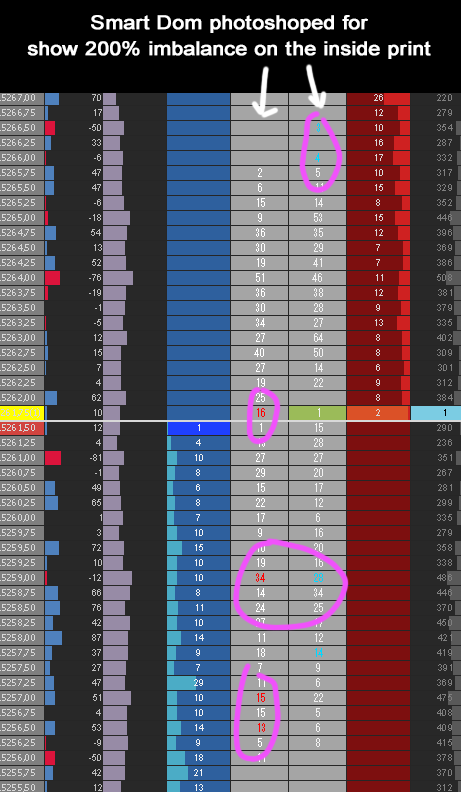
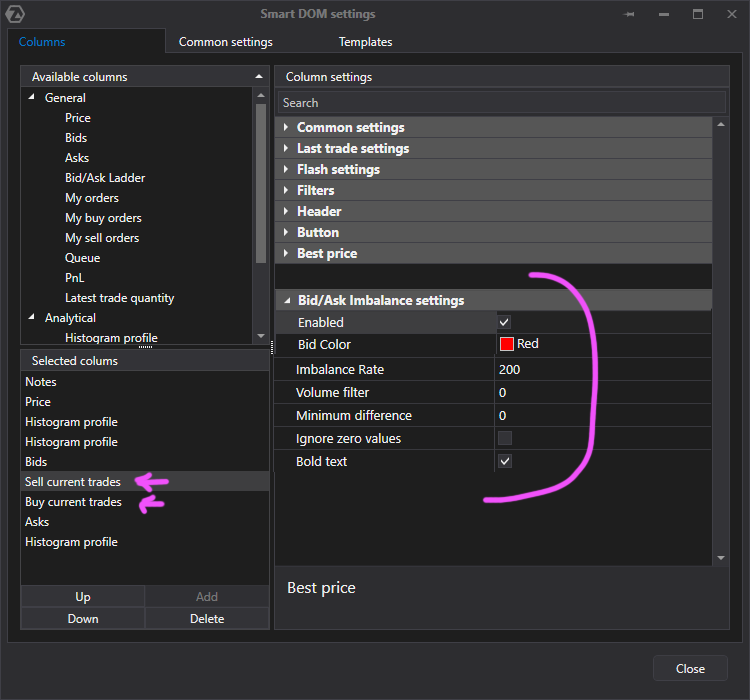
DOM : show imbalance on the inside print
To improve our speed of reading market orders in the Smart DOM, I think it would be great to be able to display imbalances with the same options as a footprint chart.
We'd have a better view of absorption, aggression and exhaustion in real time, for more efficient scalping.
My others ideas for the smart DOM :
- import .csv levels
https://feedback.atas.net/submissions/64fca46c01e8df9b20c0f480
- "note" column is filled with levels from chart
https://feedback.atas.net/submissions/64f0ea055527814abb46cd08
- DOM histogram with custom start and end hour
https://feedback.atas.net/submissions/64e65a7b89746e7cf70c5ba7
Here's how it would look:
Please authenticate to join the conversation.
In review
💡 Feature Request
Almost 3 years ago

Jean-Philippe
Subscribe to post
Get notified by email when there are changes.
In review
💡 Feature Request
Almost 3 years ago
Jean-Philippe
Subscribe to post
Get notified by email when there are changes.